Key Insights
Overall, the difference between non-bank and bank interest rates is not economically meaningful for most loans, with non-bank interest rates, on average, 58 basis points higher than banks, controlling for loan and borrower characteristics.
Non-banks provide loans somewhat faster than banks, which borrowers may be willing to pay additional interest for. However, loans associated with real estate, a sector which accounts for 50% of non-bank lending in recent years, have a higher premium, implying these lenders are enabling access to a different segment of the credit market.
While this lending can entail macro-financial benefits, by supporting property development and diversifying risk across the financial system, it also means that non-bank real estate lending may be highly sensitive to market conditions.
Introduction
Non-bank lending in Ireland
Non-bank lending has become an established feature of Ireland’s credit market over the previous decade, especially for small and medium enterprises (SMEs). In 2022 Q4, loans from non-bank financial institutions, commonly referred to as non-bank lenders, accounted for around 30% of new loan agreements with Irish SMEs, up from 20% in 2018 Q1.This Insight intends to add to existing financial stability analysis in this area by assessing what differences in interest rates between bank and non-bank loans may indicate about the widespread use of non-bank loans..
One explanation for non-bank lenders’ position in Ireland’s credit market is that they are a source of competition to banks. If this is true, it would be expected that non-banks have accumulated market share by providing loans to borrowers on competitive terms. Alternatively, it could be the case that non-bank lenders provide access to credit for borrowers, enabling companies to tap sources of finance that might not have otherwise been available.,
The role of non-banks in the market
Access and competition have different implications for financial stability. If non-bank lending has grown due to access, then adverse macro-financial conditions may lead to a realisation of credit risk amongst non-bank borrowers. If growth is due to competition, non-bank borrowers’ credit risk should not be materially different to that of other borrowers. The diversity of non-bank lenders, loan products and borrowers means that each explanation could be true for different lending segments.
Domestic and international research suggests non-bank lending provides access to weaker borrowers (e.g. less profitable and more leveraged). Domestically, SMEs that borrow from non-banks tend to be younger, less liquid and have higher leverage (Gaffney & McGeever, 2022). International evidence is more extensive, and suggests that non-bank borrowers tend to be weaker.
Non-bank lenders are relevant for financial stability through other channels. Non-bank lending brings diversification benefits to the financial sector by reducing interconnections between Irish banks and Irish borrowers, but their financing structure may leave them vulnerable to changing market conditions, with potential downstream impacts for credit supply to firms (Moloney et al, 2023).
The difference in interest rates between bank and non-bank loans is estimated to provide suggestive, but not conclusive, evidence on which explanation is more likely. The intuition behind this is that borrowers do not go to non-bank lenders because they are competitive in price if non-banks charge higher interest rates., Likewise, determining whether non-bank loans are more likely to experience payment difficulties will also be indicative of whether access or competition is a better explanation.
The evidence
This Insight utilises an enriched version of the Central Credit Register (CCR) data to answer these questions. The CCR captures every loan agreement of over €500 borrowed by Irish residents or governed by Irish law. The CCR is enriched with Dun and Bradstreet, Companies Registration Office (CRO) data and internal data sources to complete missing fields and incorporate borrower financials.
Non-banks charge an interest rate premium over banks that is not economically meaningful for most loans, but loans associated with real estate lending see a more material difference. Non-bank interest rates are, on average, 58 basis points (bps) higher than banks’, translating to around a €5 difference in monthly repayments. This is suggestive that non-bank lending is unlikely to be a story of access in general. However, loans associated with real estate may be an exception to this given their substantially higher premium, implying a heightened degree of credit risk amongst real estate borrowers. While this entails macro-financial benefits, by diversifying risk across the financial system and supporting property development, it also means that non-bank real estate lending may be more sensitive to market conditions and support a build-up of credit risk.
Non-bank lending and interest rate premia
Overview of lending and interest rates
Lending by non-banks is heavily concentrated in a small number of sectors, particularly real estate. Of €17.4bn in new loan agreements over 2018-2022, approximately 50% has been provided to borrowers in the real estate and construction sectors. A further 20% is accounted for by borrowers in the administration and support service activities sector (aircraft lessors make up a significant portion of this). It is estimated that approximately 46% of new loan agreements (by value) have been provided to SMEs. Fixed-rate loans accounted for approximately 58% of non-bank loans by value.
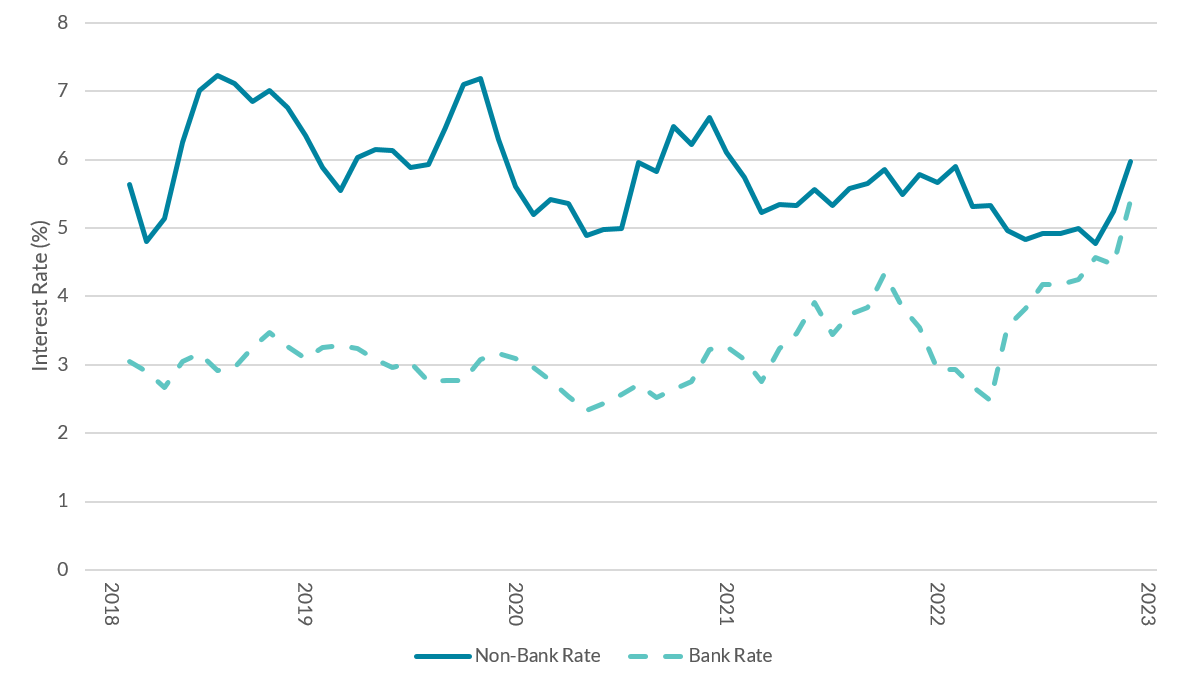
Interest rates on non-bank loans are generally higher than banks
Figure 1: Weighted average interest rates on bank and non-bank loans, by month
Source: Central Credit Register.
Note: Interest rates reported are 3 month rolling averages.
Accessibility: Get the data in Accessible format.
The weighted average interest rate on new loan agreements is higher for non-banks over the period. The monthly weighted average interest rate on non-bank new loan agreements to non-financial corporates is generally between 5% and 7% over 2018-2022, as compared to between 2% and 5% for banks (see Figure 1).
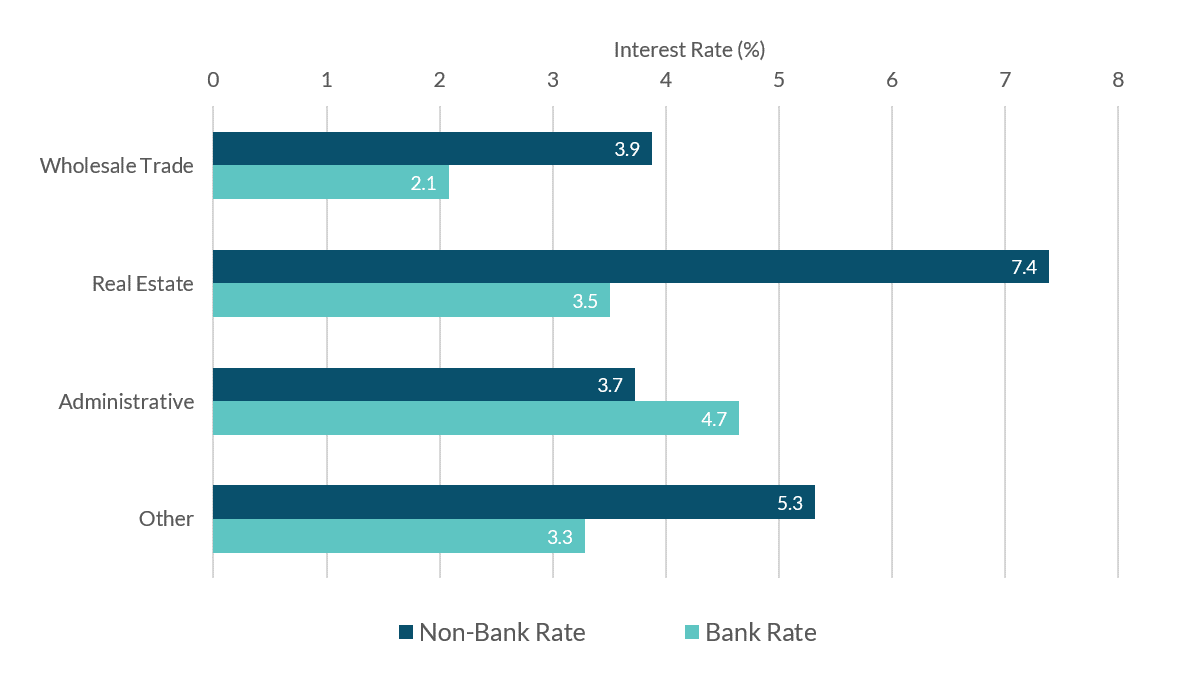
Non-bank interest rates are highest for loans to real estate & construction borrowers
Figure 2: Weighted average interest rates on bank and non-bank loans, by sector
Source: Central Credit Register.
Note: Data cover 2018-2022. NACE sector names have their names shortened. Administrative = Administrative and Support Services; Real Estate = Real Estate Activities and Construction (two separate NACE sectors); Wholesale Trade = Wholesale and Retail Trade; Other = everything else.
Accessibility: Get the data in Accessible format.
Interest rates on non-bank loans show significant variation across loan and borrower type, with property related loans showing the highest interest rates (see Figure 2). Amongst borrower types that constitute the largest portion of non-bank lending, real estate and construction borrowers have the highest interest rates on new loan agreements and the largest interest rate differential relative to banks. Non-bank loans to administrative services borrowers see the lowest rates, and are below those of banks.
Comparing bank and non-bank interest rates
Regression analysis is used to estimate the average difference in rates between bank and non-bank loans while controlling for other factors. These other factors include borrower characteristics (borrower age, location, sector and size), loan characteristics (maturity, interest rate type, loan type and loan size), borrower financials (net income and leverage) and local macroeconomic conditions (captured by county-year-sector interaction dummies). These controls should remove variation between bank and non-bank interest rates resulting from compositional differences in who they lend to (e.g. if more non-bank borrowers are in riskier sectors). A specification that compares variation in interest rates between bank and non-bank loans to the same borrower is also included.
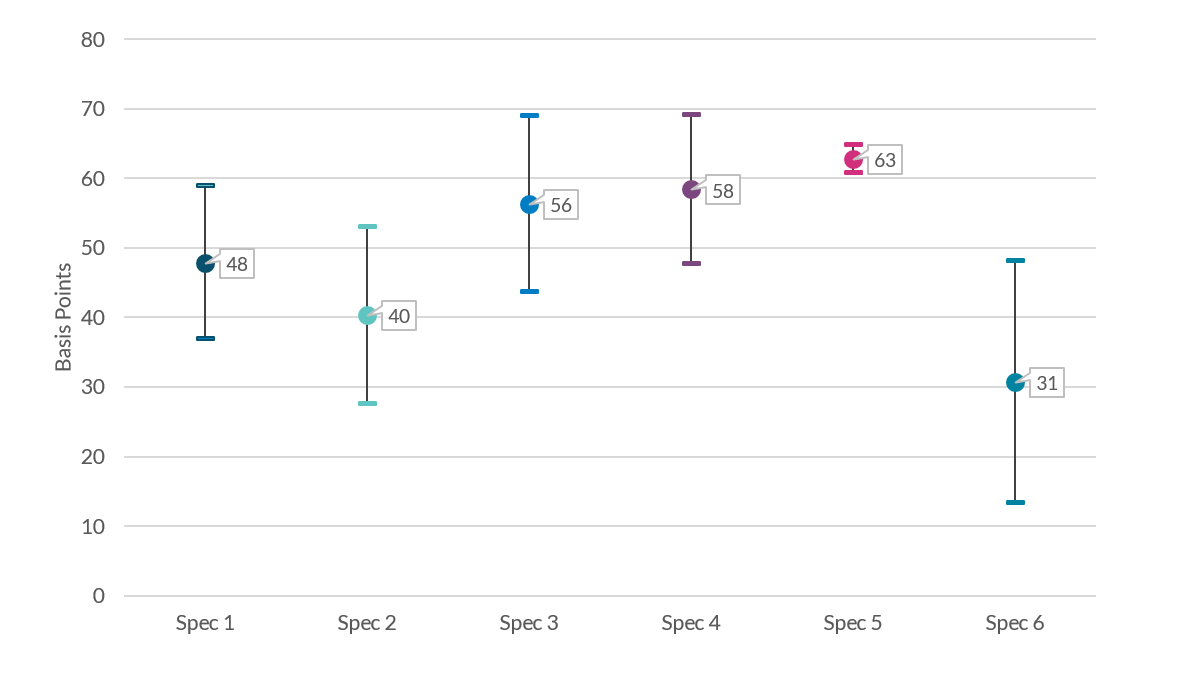
The results show that non-bank lenders charge interest rates 58 bps higher than banks. The estimate of specification 4 is preferred as it combines a broad sample with controls for borrower characteristics, loan characteristics and variation due to borrowers combined county, sector and time of loan application, but all specifications show an interest rate premium (Figure 3).
Differences in interest rates for the same borrower suggest the premium observed is due to differences in loans as well as differences between borrowers (specification 6). Non-bank loans have interest rates that are on average 31 bps higher to the same borrower. If this reflects differences in risk, it may indicate that non-bank loans are more likely to be subordinated, unsecured, or are secured on less valuable collateral.
Interest rates are consistently higher on non-bank loans, even accounting for borrower characteristics, loan characteristics and local conditions
Figure 3: Coefficient plot of the non-bank dummy variable estimate by specification
Source: Authors’ calculations.
Note: The coefficient represents the average difference between bank and non-bank loans, controlling for different sets of variables. The dot is the coefficient estimate and bars are 95% confidence intervals. Specification 1 includes a quarter dummy. Specification 2 adds borrower characteristics. Specification 3 adds loan characteristics. Specification 4 adds time-county-borrower sector interactions. Specification 5 adds borrower financials. Specification 6 limits the sample to only those borrowers who have borrowed from both banks and non-banks, and looks at the within borrower variation, while controlling for time-varying borrower characteristics, loan characteristics and borrower financials. Standard errors are clustered at the borrower level.
Accessibility: Get the data in Accessible format.
However, the practical impact of this interest rate differential is limited due to the small size of most loans. A premium of 58 bps is not negligible on the largest loans, but it leads to a median difference in monthly payments of around €5. The 58 bps premium is 30% greater than the largest average difference in interest rates observed between Irish retail banks.
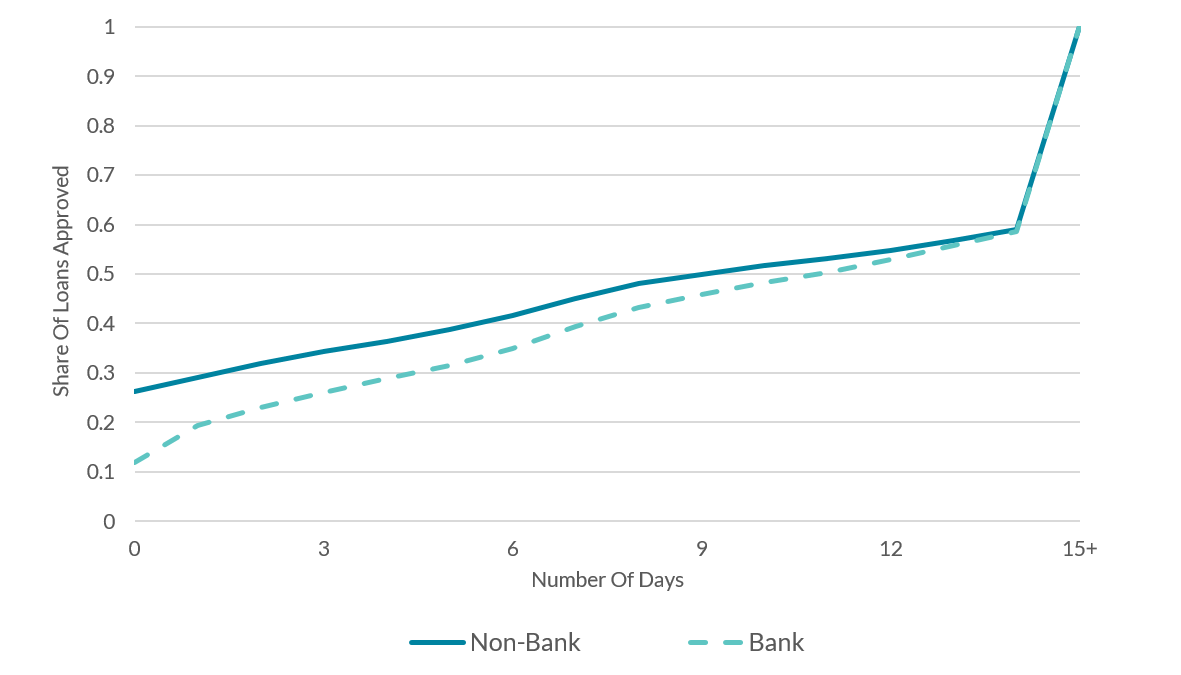
Non-bank lenders approve loans slightly quicker than banks (see Figure 4): Approximately 45% of non-bank loans are approved within a week, as compared to 39% for banks, although there is no difference by two weeks. Using the same controls as specification 4, non-bank lenders provide loans on average 2 days quicker than banks, while the probability that a loan is agreed on the day it is requested is 15 percentage points higher for non-banks. Given the small average difference in cost of finance, borrowers who need funds quickly would likely find non-banks loans more attractive.
Non-banks typically approve loans faster than banks
Figure 4: Share of loans approved by days since loan request (cumulative)
Source: Central Credit Register, Authors’ calculations.
Note: Horizontal axis is number of days. Approval time is calculated as loan start date minus loan request date. Lines are cumulative shares of loans approved by a given number of days after loan is requested (e.g. share of all loans approved by 7 days after a loan request has been received).
Accessibility: Get the data in Accessible format.
Non-bank loan applications proceed to loan agreements at a higher rate than bank loans, implying a lower rejection rate. Using the same controls as specification 4, non-bank loans are 17.6 percentage points more likely to proceed from application to a loan agreement. Determining what proportion of this 17.6 percentage points is due to borrowers choosing not to proceed and lenders rejecting applications is not possible. However, survey evidence has shown that non-bank lenders reject applications at a lower rate (Department of Finance, 2022), suggesting that some of this estimate is due to lower rejection rates. Limiting the comparison to the same borrower in the same year, non-bank loans are 17.1 percentage points more likely to proceed to a loan agreement.
Non-bank loans were more likely to encounter payment difficulties than bank loans. The CCR provides information on whether a loan has been overdue, restructured or subject to conditions indicative of default. Analysing loans originated over 2018-2022 and tracking their status to October 2024, non-bank loans are 2.1 percentage points more likely to observe an overdue payment than bank loans, 2.1 percentage points more likely to be restructured, and 0.3 percentage points more likely to default. The rate of default and restructuring for the sample as a whole are around 1.2%, so on a relative basis non-bank loans do have a materially higher level of restructuring, but in an absolute sense this is still a limited level of loans facing payment difficulties. These estimates are comparable to differences between Irish retail banks.
Exploring non-bank interest rate differentials
The diversity of non-bank business models may mask significant differences between certain borrower categories and lending segments. As noted in Moloney et al. (2023) many non-bank lenders specialise in making certain types of loans (e.g. leasing) or lending to certain borrowers (e.g. real estate companies). To assess whether aggregate differences between bank and non-bank loans obscure differences within sub-segments, this section splits the sample along various characteristics and assesses how the premium changes.
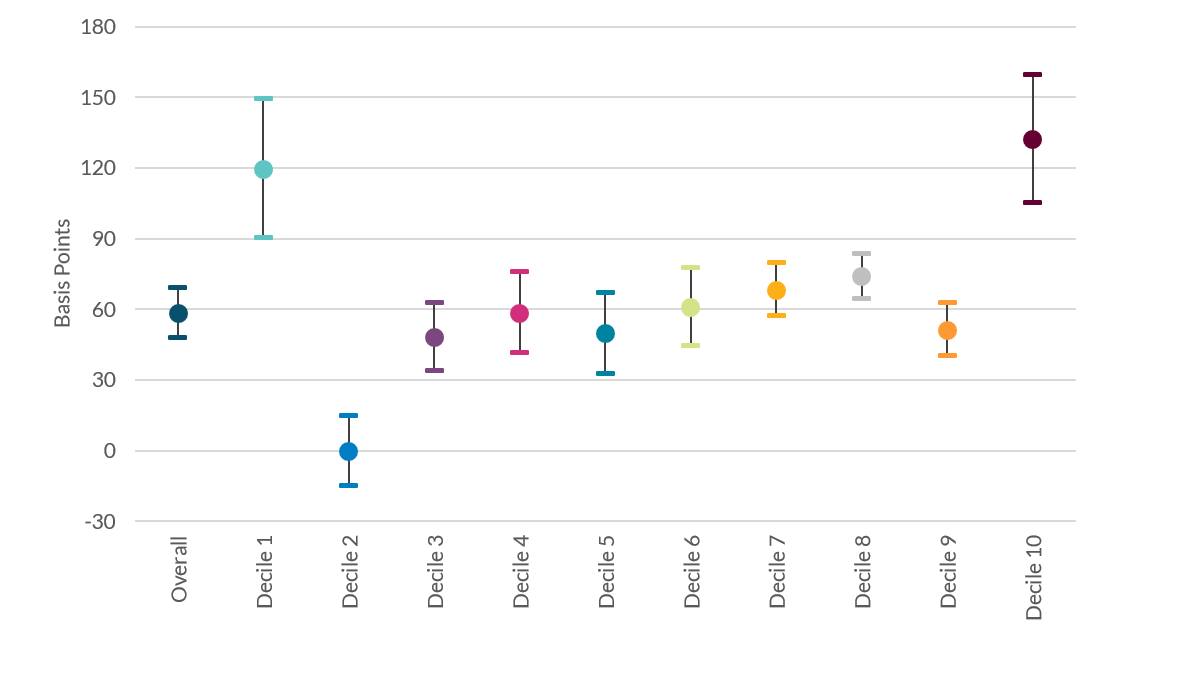
Results are relatively stable across the loan size distribution, but higher at the tails (see Figure 5). The largest differences are observed for the first and tenth decile, amounting to 119 bps and 132 bps, respectively. Results range between 48 and 74 bps for the third through to the ninth decile, with the second decile seeing no difference. The results of the top decile are primarily explained by real estate lending. The results for the bottom decile are less intuitive. While non-bank borrowers in this decile are somewhat weaker than other borrowers (i.e. they are younger, have lower net income and are more likely to be making a loss), these differences are not commensurate to the difference in interest rate premia.
Non-bank interest rate premia are highest for the smallest and largest loans
Figure 5: Coefficient plot of regression estimates with sample split by borrower size
Source: Authors’ calculations
Note: The coefficient represents the average difference between bank and non-bank loans using the same specification on different samples of the data. The regression controls for loan characteristics, borrower characteristics, and includes county-sector-quarter interaction fixed effects which should capture local macro trends. The dot is the coefficient estimate and the bars are 95% confidence intervals. Deciles and quartiles are defined based on the value of financed amount.
Accessibility: Get the Data in Accessible format.
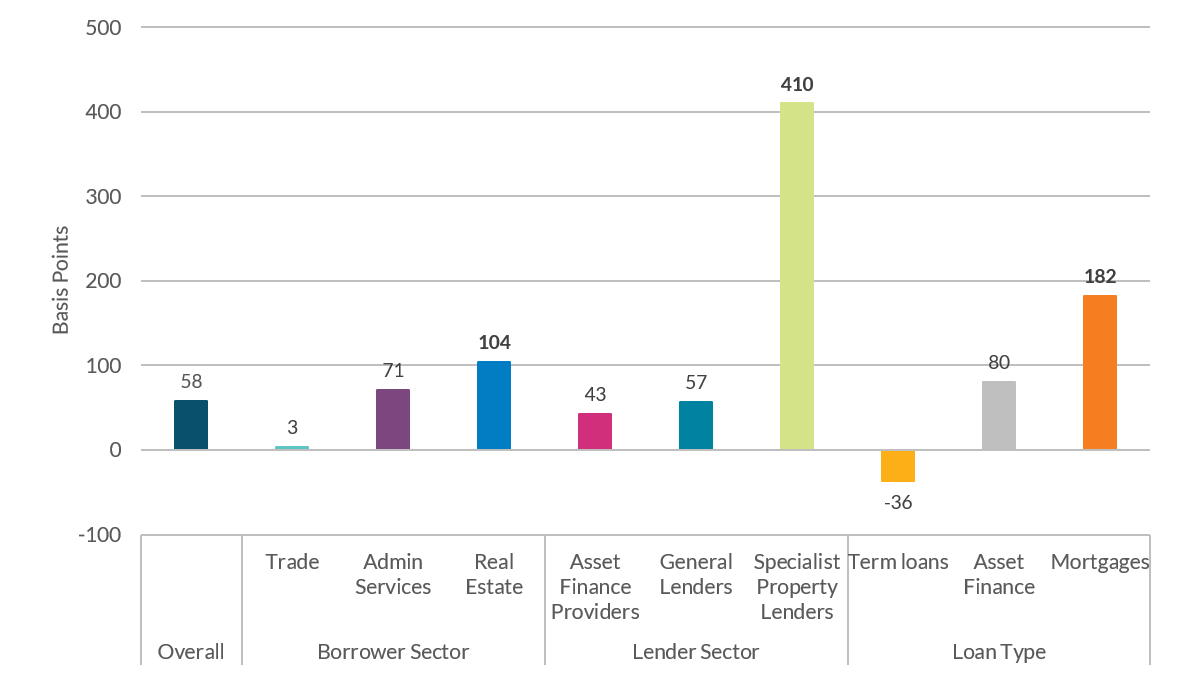
Non-bank interest rate premium are highest for loans associated with real estate lending (see Figure 6). Non-bank loans made to real estate borrowers have an interest rate premium of 104 bps. Non-bank commercial mortgages have a 182 bps premium over banks’. Similarly, reducing the sample of non-banks to include only specialist property lenders, non-bank loans have a 410 bps premium over bank loans. These differences in rates would be material for borrowers, and are suggestive that access, rather than competition is the attraction for them. Department of Finance research supports this view, yielding the insight that non-bank lenders finance borrowers and projects ‘higher up the risk curve than domestic banks’ (Department of Finance, 2024).
The premium for real estate-related loans is consistently larger than other types of loans
Figure 6: Coefficient plot of regression estimates with sample split by loan type, borrower and lender sector
Source: Authors’ calculations
Note: The bar (coefficient) represents the average difference between bank and non-bank loans using the same specification on different samples of the data. The regression controls for loan and borrower characteristics, and includes county-sector-quarter interaction fixed effects, as applicable, which should capture local macro trends. The “Other” category has been omitted from the clusters for visual and explanatory purposes.
Accessibility: Get the data in Accessible format.
This likely reflects characteristics of real estate loans non-bank lenders provide as well as the riskiness of underlying borrowers. Survey evidence (KPMG, 2023) indicates that non-banks provide loans with substantially higher loan-to-value/loan-to-cost ratios than banks, which should come with a higher interest rate. Anecdotally, non-banks also provide riskier loan products, such as bridging loans and mezzanine financing.
The premia on real estate loans are of relevance for financial stability. Real estate is a systemically important sector for the Irish economy. Concentration of risk within these lenders will make them more sensitive to adverse property market movements, and thus they may amplify negative shocks by reducing their credit supply. However, this type of lending also brings financial stability benefits by diversifying risk across the financial system.
There are also certain lending segments where the non-bank premium is lower than the full sample estimate. Non-bank loans to borrowers from the retail and wholesale trade sector see practically no difference in banks to interest rates. These borrowers receive a large share of non-bank finance from asset finance providers, who see a difference of 43 bps between bank and non-bank loans. Looking across categories of lending, business loans provided by non-banks are 36 basis points cheaper than banks. In these cases, an explanation of non-banks acting as a source of competition is plausible.
Conclusion
Taken together, the evidence does not clearly suggest that this is a story of access for most borrowers. The premium charged by non-banks is not economically meaningful for most loans. In addition, non-banks provide loans somewhat faster than banks, which borrowers may be willing to pay additional interest for. Furthermore, indicators of ex-post distress display limited differences in outcomes. While the sample period coincided with extensive government supports that suppressed distress for all businesses, measures of distress and restructuring for non-bank SME borrowers remained subdued into 2023 (see chart 38 in Financial Stability Review 2024:I (2024)).
However, the interest rate differentials on lending for real estate and construction are more material and align with a story of access. This lending is risky by nature, so it is not surprising that non-bank loans to these borrowers have high interest rates. But the fact that non-banks specialising in this lending, or loan types associated with these borrowers (i.e. commercial mortgages), consistently show the largest interest rate differentials does suggest that non-banks may be concentrated in the riskiest real estate and construction loans. This can entail macro-financial benefits by diversifying risk across the financial system and supporting property development. But it would also mean that non-bank real estate lending may be highly sensitive to market conditions. Given the importance of commercial real estate for financial stability, this type of lending should continue to be monitored.
References
Agarwal, S., Grigsby, J., Hortaçsu, A., Matvos, G., Seru, A., & Yao, V. (2024). Searching for Approval. Econometrica.
Brandão-Marques, L., Chen, Q., Raddatz, C., Vandenbussche, J., & Xie, P. (2022). The riskiness of credit allocation and financial stability. Journal of Financial Intermediation.
Central Bank of Ireland. (2024). Financial Stability Review 2024:I. Dublin: Central Bank of Ireland.
Chernenko, S., Erel, I., & Prilmeier, R. (2022). Why Do Firms Borrow Directly from Nonbanks. The Review of Financial Studies, 35(11), 4902-4947.
Dell'Ariccia, G., Igan, D., & Laevan, L. (2012). Credit Booms and Lending Standards: Evidence from the Subprime Mortgage Market. Journal of Money, Credit and Banking, 44(2/3), 367-384.
Denis, D., & Mihov, V. (2003). The choice among bank debt, non-bank private debt, and public debt: evidence from new corporate borrowings. Journal of Financial Economics, 70(1), 3-28.
Department of Finance. (2022, September 13). SME Credit Demand Survey – October 2021 to March 2022.
Gaffney, E., & McGeever, N. (2022). The SME-lender relationship network in Ireland. Central Bank of Ireland Financial Stability Notes 2022/14. Central Bank of Ireland.
Gaffney, E., Hennessy, F., & McCann, F. (2022). Non-bank mortgage lending in Ireland: recent developments and macroprudential considerations . Central Bank of Ireland Financial Stability Notes 3/22.
KPMG. (2023). Irish Real Estate Lending Survey.
Moloney, K., O'Gorman, P., O'Sullivan, M., & Reddan, P. (2023). Non-bank lenders to SMEs as a source of financial stability risk – a balance sheet assessment. Financial Stability Note. Central Bank of Ireland.
Tsuruta, D. (2010). Nonbank financing and performance of informationally opaque businesses. Applied Financial Economics, 20(18), 1401-1413.
Endnotes