Key Insights
While many Irish SMEs report making investments, the euro value of these investments is small.
This pattern is explained by firms being satisfied with their current size and investment rates, rather than by a lack of external finance.
When Irish SMEs do expand, their preference is to fund with internal cash resources rather than to borrow.
Around a quarter of SMEs state that external finance constraints are a barrier to investment, but factors like recent growth and attitudes to risk are statistically more important in explaining investment patterns across firms.
Introduction
Investment and the financial system
Investment is a key component in driving firm growth, innovation and productivity. In order to remain efficient and competitive, firms need to invest and adopt new technologies (as well as replace existing depreciated stock). This business dynamism drives expansion into new markets, ensures viability versus new entrants, and may improve access to external credit (through greater collateralisable assets). In contrast, lower investment can reduce the adaptability of firms to external economic shocks. Existing evidence points to a divergence in the investment patterns of foreign and domestic-owned (SME dominated) firms (for example, see Department of Finance (2024)) – with the latter having weak investment and MNEs dominating the capital stock.
The financial system plays a role in mediating this activity by financing investment, and credit constraints could undermine the ability of firms to increase productivity and expand. Understanding the drivers and barriers of this activity, as well how this behaviour compares with euro area firms, provides a picture of the dynamism, innovation and competitiveness of domestic firms. Our Insight examines this SME investment behaviour by answering three key questions. First, are SMEs investing and how are they financing it? Second, how does Irish SME investment compare to euro area peers? Third, what are the key drivers of SME investment?
What have previous studies found?
There is some evidence that Ireland’s indigenous investment rate is low, especially compared to other European Union (EU) countries (Department of Finance (2024), Boyd et al. (2025)). In addition, Martinez-Cillero, Lawless and O’Toole (2023) find external finance constraints are leading to underinvestment (via the existence of investment shortfalls). Using a panel of SMEs in twelve European countries (including Ireland), Gomez (2019) finds a negative relationship between external finance constraints and the probability of investing – with the impact of constraints on firm-level investment largely independent of firm size, age or ownership structure. Another potential explanation for low aggregate investment is that resources are split over too many firms, limiting investment at scale (Department of Finance, 2024). In contrast, Gargan et al. (2024) find no evidence that the share of investing Irish SMEs is dramatically lower than euro area peers, although there is underinvestment in research and development.
SME investment in Ireland
Our Insight uses granular firm-level survey data to examine the relationship between investment rates, investment barriers and firm characteristics. In contrast to the other papers cited, we focus on recent waves of data – this is because the 2023 survey crucially added an investment block of questions covering investment rates, attitudes to investment and funding sources. This allows us to hone in on the investment behaviour of Irish SMEs, which was not possible in previous survey waves. This data is from the Department of Finance Credit Demand Survey (CDS), sampling c.1,500 SMEs per wave. We also use the EU/ECB Survey on the Access to Finance of Enterprises (SAFE) for cross-country comparisons.
We show that most SMEs in Ireland do invest, but the average investment rate is low particularly in comparison to firms in similarly sized European countries. Small and micro firms in Ireland also contribute a relatively low share of value added compared with other EU countries, which may be explained by the presence of a highly productive and investment-intensive cohort of foreign MNEs.
Almost all investment is in tangible, fixed assets with productivity-enhancing investments such as research and development accounting for just five per cent of the total. Furthermore, firms prefer not to borrow to fund expansion and most firms are content with their current size, which suggests that domestic SMEs are unlikely to close the gap to similar firms in other countries.
Finally, cross-country survey data from SAFE show that, while around 70 per cent of Irish SMEs made some investment in 2023, the scale of this investment per employee is smaller than comparable countries, which could explain weakness at an aggregate level.
New evidence on credit constraints and investments
Around a quarter of SMEs report that external finance constraints are hampering investment, with uncertainty cited as the most common barrier. Our empirical model does show that, even controlling for other key drivers, external finance constraints have a statistically significant and negative effect on investment, although their relative economic significance is small. Nevertheless, the result reflects responses of a sizeable minority of firms, and provides a contribution relative to previous studies which did not include this data on investment barriers. The empirical model shows that, when conditioning on all key factors, sales growth and attitudes to risk have the most important impact on investment rates.
Are SMEs investing and how are they financing it?
Stylised facts on investment by domestic firms are documented in Department of Finance (2024). Domestic Irish firms tend to have low rates of investment and lag behind international peers. Trends in investment have diverged significantly between Ireland’s foreign-dominated sectors and domestic-orientated sectors. While MNEs have seen strong investment growth over the past decade, investment by domestic firms has been weak. Activity in these domestic-orientated sectors is driven largely by SMEs, and the investment rate of these firms as a percentage of GNI* has been below long-run local and European averages. In this section, we use Irish micro data to look at some key characteristics of Irish SMEs that invest, versus those that do not.
Table 1: Summary Statistics for Non-Investing and Investing SMEs
| | No Investment Mean | No Investment Median | Investment Mean | Investment Median |
|---|
| Turnover (€) | 3,698,784 | 750,001 | 5,272,772 | 1,500,001 |
| Turnover growth | 1.86% | 0% | 5.41% | 4% |
| Expenditure (€) | 3,419,053 | 600,000 | 4,725,942 | 1,100,000 |
| Price Change | 3.94% | 0% | 4.82% | 4% |
| Profit Change | 2.98% | 0% | 2.57% | 0% |
| Profit Margin | 0.27 | 0.22 | 0.25 | 0.2 |
| Leverage | 0.26 | 0.05 | 0.23 | 0.1 |
Source: Department of Finance Credit Demand Survey.
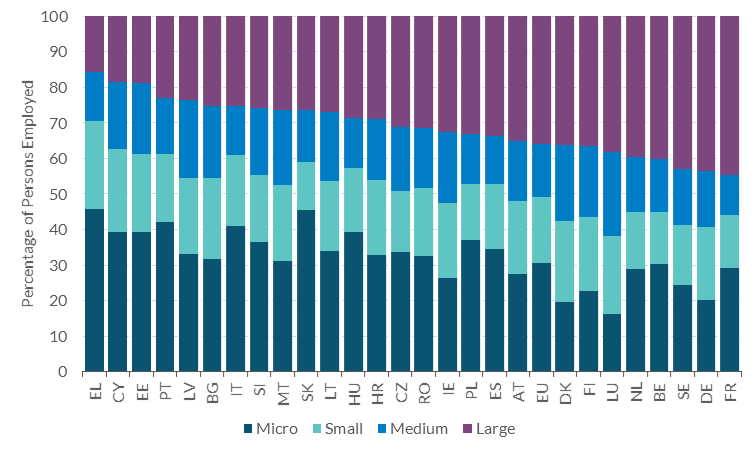
SMEs that do invest tend to be larger – on average, investing firms have higher turnover, turnover growth, expenditure, and price changes compared to non-investing SMEs (Table 1). In addition, they have lower profit margins and leverage (i.e. debt-to-total assets ratio). The sector is dominated by a large number of very small enterprises and just over 92 per cent were classed as micro in 2021. However, this is not unusual and similar size structures are evident in other countries both in terms of number of firms and employment levels. For example, Figure 1 shows the size distribution of firms by persons employed across EU countries, with Ireland relatively close to average. These patterns suggest that, despite the possibility that the highly productive MNE sector in Ireland “crowds out” Irish SME investment, there is no discernible evidence that this has distorted the firm size distribution in Ireland.
Share of SMEs in Ireland is close to the EU average
Figure 1: Size distribution of firms by persons employed (2023)
Source: Eurostat.
Accessibility: Get the data in accessible format. (CSV 1.43KB)
While the size distribution of Irish firms is not unusual, domestic firms stand out as having a lower investment rate and contribution to economic output. For example, Lawless (2025) shows that investment per employee and the productivity level in Ireland’s domestic sector is significantly smaller than that of comparable small, open economies. While we may not expect investment rates in the domestic sector to be at the same scale as the MNE sector, substantial underinvestment by Irish SMEs, relative to similarly sized firms elsewhere, could be suggestive of a structural feature whereby the strength of the MNE sector “crowds out” investment activity among local firms.
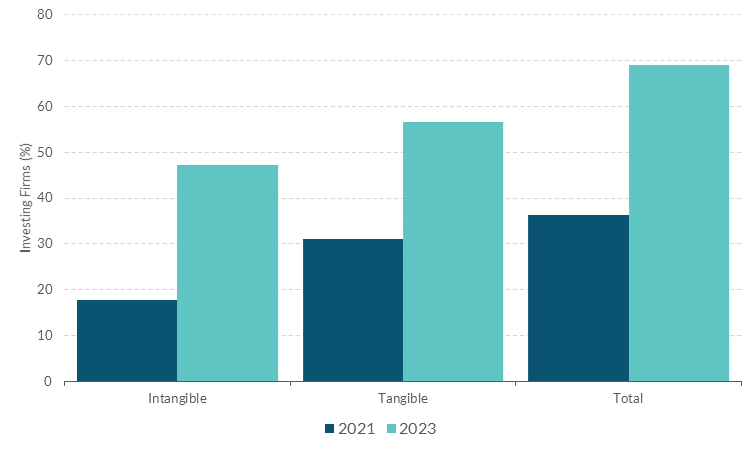
Following on from the cross-country evidence of Lawless (2025), we explore the CDS data for further evidence of underinvestment among Irish SMEs. Even though most SMEs are making some form of investment, the average size is small. For example, most investment made by micro firms was below €10,000, with an average investment of €6,000 per employee. This is consistent with the finding of Lawless (2025) that investment at Irish domestic firms is €7,000 per employee, making it the lowest of eight comparable economies. As a result, even though around 70 per cent of SMEs made some investment in 2023 (Figure 2), investment rates are low by international standards.
More SMEs made investments in 2023 than in 2021
Figure 2: Percentage of SMEs making investments in 2021 and 2023
Source: Department of Finance Credit Demand Survey.
Note: Survey weights applied to SME responses.
Accessibility: Get the Data in Accessible format. (CSV 0.07KB)
Low levels of productive investment and borrowing
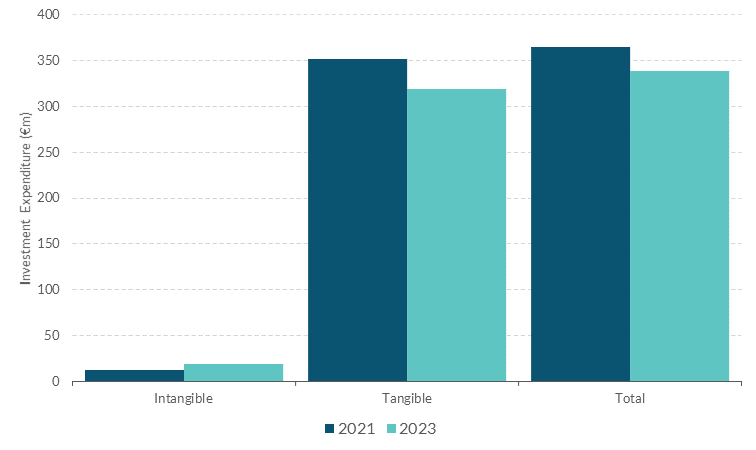
The CDS data shows almost all investment is towards tangible assets, which is likely to pose challenges for SME productivity (Figure 3). Despite intangible investment increasing in 2023, tangible investments accounted for around 95 per cent of expenditure in both waves, with buildings being the most common purpose. This is consistent with previous reports on SME investment activity (see, for example, Kren et al. (2025) and Cantillon et al. (2022)).There is evidence that intangible investments are a good proxy for productivity enhancements, even when combined with higher debt levels (Karmakar, Melolinna and Schnattinger, 2024). Low levels of investment in aggregate, and prominence of fixed assets, suggests that domestic-orientated firms will continue to lag behind peers in similarly sized economies.
Tangible assets constitute the bulk of SME investment in 2021 and 2023
Figure 3: SME investment expenditure in 2021 and 2023
Source: Department of Finance Credit Demand Survey.
Note: Survey weights applied to SME responses.
Accessibility: Get the Data in Accessible format. (CSV 0.08KB)
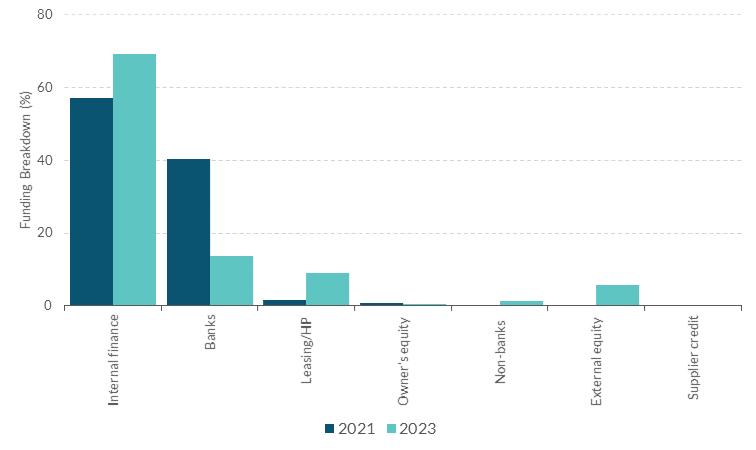
There is a low level of reliance on credit as a source of funding, and SMEs appear to have a preference against expansion. Internal finance accounted for the majority of funding in both survey waves (Figure 4). Although banks were the second most common source of funds, there was a sharp decline from 40 to 14 per cent between 2021 and 2023. This drop coincides with the ECB hike in interest rates (resulting in higher borrowing costs), but can also be explained by a fall in building investment between 2021 and 2023, which likely required lower external funding. While SMEs in the CDS are quite evenly split on willingness to borrow to fund expansion, 80 per cent of firms in the survey state that they are happy with their current size. The result suggests an aversion to expanding, with most SMEs not in sectors or stages in their lifecycle where high growth is desirable, and in the final section we explore in more detail what is driving investment decisions.
Most investment is funded using internal resources, while use of bank funding decreased between 2021 and 2023
Figure 4: Funding breakdown of SME investment in 2021 and 2023
Source: Department of Finance Credit Demand Survey.
Note: Survey weights applied to SME responses. Breakdown based on Euro amount attributed to each source of funding.
Accessibility: Get the Data in Accessible format. (CSV 0.18KB)
How does Irish SME investment compare to euro area counterparts?
Comparing Ireland and the euro area
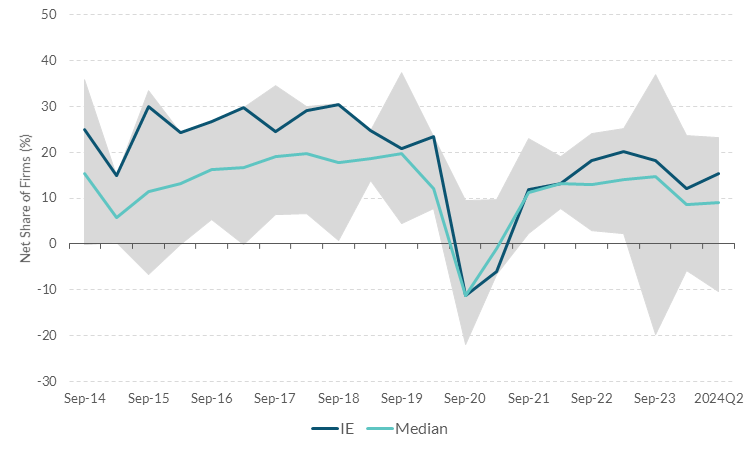
Cross-country data from SAFE shows that Irish SME investment growth has fallen relative to other euro area countries since the pandemic (Figure 5). While Irish investment growth was close to (or at) the euro area maximum, now it has have shifted down towards the euro area median. Neither have returned to pre-COVID levels, but the euro area median has rebounded to a greater extent.
Post-COVID the proportion of Irish SMEs growing investment is near the euro area median
Figure 5: Investment balance statistics (proportion reporting up minus proportion reporting down) for the euro area
Source: ECB Survey on the Access to Finance of Enterprises (SAFE).
Note: Survey weights applied to SME responses. Shaded region is the euro area maximum-minimum difference.
Accessibility: Get the Data in Accessible format. (CSV 0.9KB)
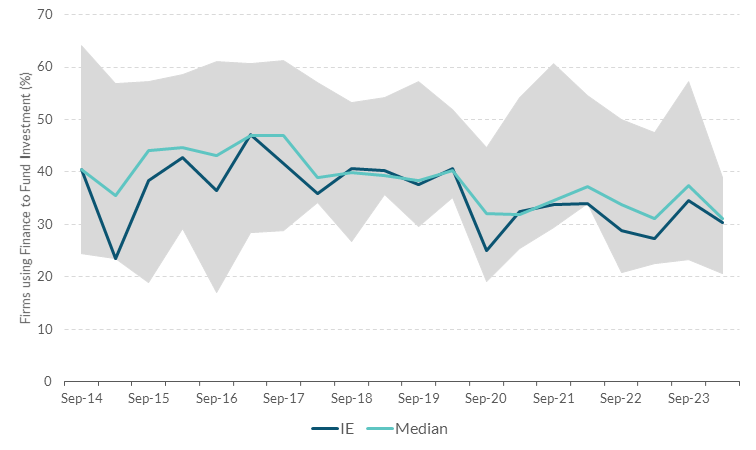
The proportion of Irish SMEs using finance to fund investment is typically close to the euro area median, but has declined since the pandemic (Figure 6). There has been a distinct change over time with the Irish series decreasing from 2020 onwards, and not returning to its pre-COVID values. For example, the pre-COVID average for Ireland is 39 per cent, but this decreases to 32 per cent post-COVID.
Proportion of Irish SMEs using finance to fund investment is typically close to the euro area median
Figure 6: Proportion of SMEs using finance to fund investment
Source: ECB Survey on the Access to Finance of Enterprises (SAFE).
Note: Survey weights applied to SME responses. Shaded region is the euro area maximum-minimum difference. Includes only SMEs that made an investment.
Accessibility: Get the Data in Accessible format. (CSV 1.84KB)
According to the SAFE survey evidence described here, investment patterns (at the extensive margin) of Irish SMEs and their euro area counterparts appear to be relatively similar, but this may mask differences in the euro value of investments made. Data from SAFE shows no evidence to support a claim that Irish SMEs are investing less than their euro are counterparts, which is in line with Gargan et al. (2024), but contrasts with cross-country quantitative data showing Ireland lagging behind peers (see Department of Finance (2024)). One reason for this apparent disagreement is the survey does not contain quantitative data on the size of Irish investment relative to euro area peers, or the share of high-growth firms. This means that Irish firms may be investing, not making large enough investments, as evidenced by average investments of €6,000 in our CDS data, to keep aggregate investment in line with other European countries.
What are the main drivers of SME investment?
Survey evidence
In this section, we explore the drivers of investment behaviour among Irish firms. First, CDS data in 2023 shows that around a quarter of SMEs report that external finance constraints are hampering investment, and just over half of SMEs stated uncertainty was a barrier to investment (making it the most common barrier). While access to finance and credit conditions don’t affect most of the surveyed firms, structural factors mentioned in the previous section related to the prominence of MNEs and a preference against expanding are the more likely explanations for weak investment.
Data from SAFE do not suggest that Irish SMEs are more financially constrained than their euro area peers. Credit constraints for Irish SMEs are not only low, but also lower compared to euro area counterparts, with the availability of bank loans above the euro are median. Furthermore, very few firms avoid applying for a loan due to fear of rejection, and for those that apply less than 10 per cent are rejected or receive less than 75 per cent of requested funds.
Empirical test
To formally examine the main drivers of investment we use CDS data to estimate a capital error correction model – a micro-founded model derived from a firm profit maximisation problem. Our dependent variable is a firm’s investment rate (change in capital stock relative to the previous year’s capital), and we augment the standard model with our key variables of interest, including external finance constraints and uncertainty.
Sales growth and attitude to risk have the strongest relationship with investment rates. The coefficient on attitude to risk suggests that if the SME self-reports that it is ‘risk taking’ it is associated with the investment rate being about 13 per cent higher. Furthermore, the coefficient on sales growth is meaningful with 10 per cent growth in sales corresponding to 3 per cent more investment. The cash-to-capital coefficient is also positive, indicating more internal funds aligns with increased investment. However, SMEs with greater debt-to-total assets are less likely to invest which may suggest a preference to reduce debt rather than expand further, and further highlights the pattern that investment among the SME population is currently not particularly reliant on the process of financial intermediation. We also find evidence that external finance constraints do reduce investment rates, but the impact is small. Specifically, a firm reporting that external finance constraints are hampering investment has an investment rate that is 2 to 2.4 per cent lower than those that don’t, six times smaller than the effect of firms’ self-reported risk taking.
Conclusion
This Insight has focused on investment behaviour of Irish SMEs, based primarily on data contained in business surveys. We find that, even though many Irish SMEs report making investments, the euro value of these investments is small. This pattern is explained by firms being satisfied with their current size and investment rates, rather than by a lack of external finance. We show that the most important explainers of high investment rates are firms’ recent sales growth and their attitude to risk, while also showing that, when Irish SMEs do expand, their preference is to fund with internal cash resources rather than to borrow. Around a quarter of SMEs state that external finance constraints are a barrier to investment, but their economic significance is small and cannot explain low Irish investment rates relative to peers.
Our findings are consistent with the dual nature of the Irish economy – with aggregate investment driven by the activity of large multinationals. In contrast, the domestic (SME dominated) sector is not of a high-growth nature. Furthermore, the financial system does not appear to be playing a major role in determining investment patterns currently, with credit constraints playing only a small role in impeding investment, and debt levels being low among firms that do invest. These patterns may reflect a structurally weak investment profile among local firms, in an economy dominated by highly productive multinationals, the intangible-intensive nature of many high-growth firms, as well as a post-financial-crisis preference for Irish SMEs to fund investments with own-cash resources where feasible. Future research is required to fully disentangle the relative importance of these phenomena in explaining investment patterns among indigenous Irish business.
References
- Boyd, L., McCann, F., McGeever, N., and McIndoe-Calder, T. (2025) Saving to Invest? Financial Intermediation in Ireland Since the GFC. The Economic and Social Review, 56(1), 77-115.
- Cantillon, L., Gargan, E., Kren, J., Lawless, M., and O’Toole, C. (2022). Recent Trends in SME Investment in Ireland: Exploring the Pandemic and the Barriers to Growth (ESRI Survey and Statistical Report Series Number 113). ESRI.
- Department of Finance (2024). Economic Insights – Spring 2024.
- Department of Finance (2025). Economic Insights – Volume 1 2025.
- Gargan, E., Kenny, E., O’Regan, C., and O’Toole, C. (2024). A cross-country perspective on Irish enterprise investment: Do fundamentals or constraints matter? The Economic and Social Review, 55(2), 173-215.
- Gómez, M.G.P. (2019). Credit constraints, firm investment and employment: Evidence from survey data. Journal of Banking and Finance, 99(C), 121-141.
- Hurst, E., and Pugsley, B (2011). What Do Small Businesses Do? National Bureau of Economic Research Working Paper Series No. 17041
- Karmakar, S., Melolinna, M., and Schnattinger, P. (2024). What is productive investment? Insights from firm-level data for the United Kingdom. Bank of England Staff Working Paper No. 992.
- Kim, K., Xie, H., Zheng, X (2024). Are R&D-intensive firms more resilient to trade shocks? Evidence from the U.S.–China trade war. Journal of International Money and Finance, Volume 149.
- Kren, J., O’Regan, C., O’Toole, C., Rehill, L., and Smith, A. (2025). SME investment report 2024: Developments between 2016 and 2023. ESRI Survey and Statistical Report Series No. 129.
- Lawless, M. (2025). Hare or Tortoise? Productivity and Growth of Irish Domestic Firms. The Economic and Social Review, 56(1), pp.139-161.]
- Martinez-Cillero, M., Lawless, M., and O’Toole, C. (2023). Analysing SME investment, financing constraints and its determinants. A stochastic frontier approach. International Review of Economics and Finance, 85(C), 578-588.
Endnotes