Introduction
Strengthening balance sheets
In the years following the Global Financial Crisis, Irish household balance sheets have gradually strengthened through a long period of deleveraging. This process eventually led to a more stable financial position with significant liquid assets and sustainable new lending relative to incomes (Central Bank of Ireland, 2019, 2020). The resilience of balance sheets, along with significant fiscal interventions, has supported the household sector through a series of economic shocks such as the pandemic, a surge in inflation, and rising interest rates, without a material rise in mortgage arrears or defaults (Central Bank of Ireland, 2021, 2022, 2023, 2024; Adhikari and Yao 2024 (PDF 704.63KB)). However, Ireland’s economy is particularly exposed to the rise of geopolitical risks and tariffs through its position in the global value chain, with many households employed in sectors reliant on global export markets (Central Bank of Ireland, 2025 (PDF 1.4MB)). In this Insight, we test household resilience to an adverse macroeconomic shock, focusing on how mortgage borrowers can cope with changes in employment income and living expenses.
How does the scenario affect households?
The first channel affects the income side of the household budget. Ireland's economy is deeply integrated into global trade, with several sectors heavily reliant on exports, especially to major partners like the United States (Lukmanova and O’Grady, 2025). When geopolitical tensions lead to the imposition of tariffs on these exports, the resulting decline in demand can slow down production and hurt the profitability of key industries. This, in turn, can directly impact on income of workers in those sectors, threatening the primary source of income for many households.
The second channel operates through household expenditure. Tariffs and the geopolitical fragmentation add frictions to international trade, which lead to higher prices of goods for all trading nations. The resulting higher prices for goods used by Irish consumer and businesses would eventually lead to higher inflation in the future. For households, this means a higher cost-of-living, as some goods might become more expensive, squeezing disposable income and forcing difficult spending choices.
By examining these two channels, this Insight highlights how a severe macroeconomic shock, featuring large-scale geopolitical risks such as tariffs and fragmented trade, can directly affect the financial well-being of Irish household borrowers. Understanding these connections is crucial for developing strategies to protect economic resilience in an increasingly uncertain world.
How we simulate household resilience
Measuring financial resilience of households
There is no single measure that can summarise all aspects of household financial resilience in the related literature. Many papers focus solely on debt-based indicators, such as the leverage ratio or the debt-service-to-income ratio (see Jappelli et al., 2013; Michelangeli and Pietrunti, 2014). In this Insight, we choose indicators capturing households’ budget surplus/deficit - financial margins (FM) (see Ampudia et al., 2016). FM is the ratio of household expenditure (including debt payments) over disposable income. The primary advantage of this measure is the inclusion of household expenditure, which provides a more comprehensive assessment of financial health. In other words, FM indices not only account for household debt burdens, but also monthly expenses, such as food, utility and housing costs. A higher FM indicates a thinner financial buffer, and therefore a reduced ability to handle unexpected economic shocks.
Baseline and adverse macroeconomic scenarios
To simulate household financial margins, we employ two scenarios, each spanning a three-year horizon from 2025 to 2027. The first scenario (the baseline) uses a combination of Central Bank of Ireland Quarterly Bulletin forecasts and the EBA 2025 EU-wide stress test baseline scenario (see Table A1). The second scenario (the adverse) is the EBA adverse scenario, which assumes an increase in geopolitical tensions (over the baseline) leading to a strong economic contraction and temporary shock to inflation. Therefore, the difference in FM between these two scenarios can be attributed to the impact of a severe macroeconomic shock, which includes additional tariffs and heightened risks of geo-economic fragmentation.
Micro-simulation exercise
For our micro-simulation exercise, we use data from the latest Household Finance and Consumption Survey (HFCS), conducted in 2023 for Irish households. We focus only on households with a mortgage since these loans compose more than half of total assets for domestic retail banks (Central Bank Money and Banking Statistics) and any shock that heavily threatens repayment capacity could have severe implications for financial stability. A household in the survey consists of individuals who either are employed or earn a social welfare payment. Households report their consumption spendings, debt servicing costs and income. The comprehensive coverage of HFCS data allow us to directly measure how the scenario affects components of income and expenditure.
Our household level simulation comprises of four steps:
1) Cost-of-living: Based on forecasts from the EBA and Central Bank for HICP inflation (see Table A1) and its energy component, we shock total expenditure (excluding energy) and energy spending, respectively.
2) Debt payments: We account for changes in debt repayments using the annual change in long-term interest rates for Ireland, projected by EBA under the baseline and adverse scenario.
3) Employment income: We calculate income changes at the sectoral level for employed households. We assume a full pass-through of the sectoral GVA changes from the EBA scenarios. Household income from the HFCS data is then projected based on the sector of employment for the household’s head. For each year of the scenario this results in a single income growth rate for all employed households in each sector under baseline and adverse conditions. Within sectors there is no divergence in household income growth, meaning that in practical terms these households all continue in employment.
4) Financial Margin: We calculate two metrics of household financial resilience:
- Our headline results are based on a “core-FM” measure, following Valderrama et al. (2023), who introduce a cost-of-living adjusted FM with the focus on essential expenses, such as food and utility, along with debt servicing over monthly disposable income. A household is considered distressed, if their essential consumption plus debt servicing payments exceeds 70 per cent of disposable income.
- For robustness, we also consider another measure of FM, which takes all consumption spending into account, along with debt payments. Under this broader measure, we classify households as distressed when FM exceeds one – that is, a household cannot cover their expenses with their income over the year.
Current levels of household borrower resilience
Financial margins in 2024
We present our core-FM measure, which provides a detailed view of how households can manage day-to-day costs and their ability to absorb further increases in prices, interest rates or a decline in their incomes during stressed periods.
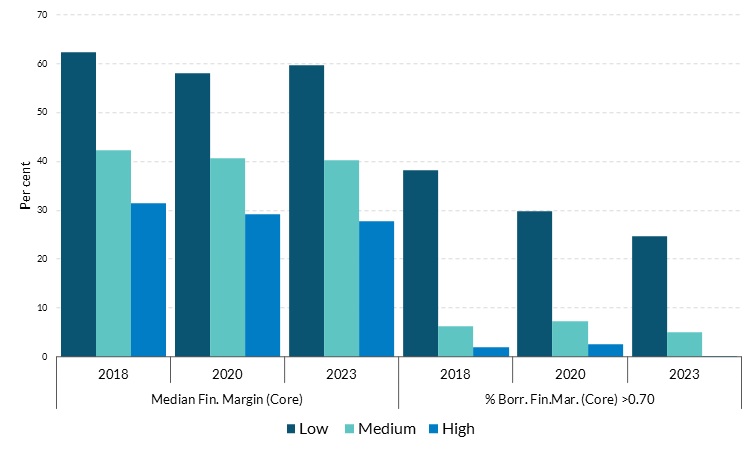
Figure 1 presents the core-FM measure across income groups and highlights that a larger share of lower-income households are stretched. In 2023, the median core-FM for low-income households stood at around 60 per cent, compared to 40 per cent for middle-income borrowers and around 28 per cent for high-income borrowers.
Financial headroom has improved since 2018 for low-income households, with household incomes growing more quickly than living costs over the past five years. The share of low-income households experiencing financial distress (unable to cover their essential expenses and debt payments using income) has declined significantly over this period, with distress rates falling from 38 per cent to 25 per cent between 2018 and 2023. This improvement points to increased resilience, despite the sharp rise in living costs and interest rates over this period. At the same time, distress rates for high and middle-income households have remained stable.
Low-income households have relatively higher median level of core-FM. Share of households with core-FM (essential consumption) exceeding 0.70 has declined across all income terciles
Figure 1: Median core-FM and share of Households with core-FM exceeding 0.70 in 2018-2023 across income terciles

Source: Household Finance and Consumption Survey.
Note: Survey weights applied. Core-FM calculated as the ratio between only essential monthly household consumption (food and utility) as well as debt payments over monthly net income. Income categories derived as terciles using gross household income.
Accessibility: Get the data in accessible format. (CSV 18.94KB)
Simulation (2025- 2027)
Household at risk under EBA scenarios
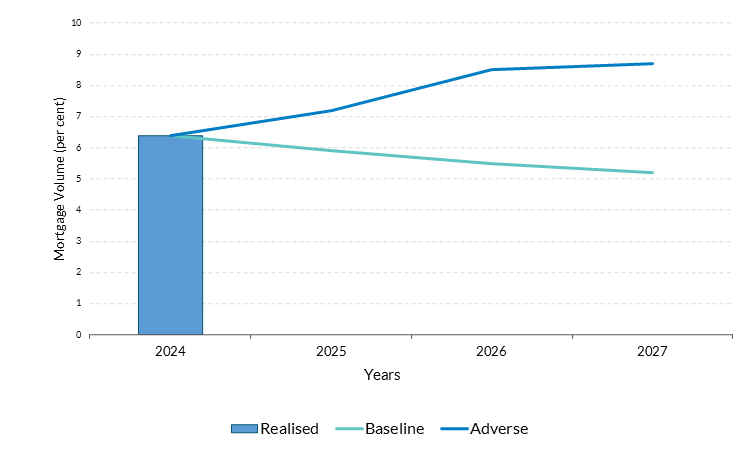
The simulation results indicate that household financial distress is expected to remain largely unchanged under the baseline scenario, improving slightly between 2025 and 2027. Figure 2 shows the share of outstanding mortgage debt held by households in financial distress – as before we define this as any household with core-FM above 0.7.
Household debt-in-distress increases from 6 to 9 per cent in the adverse scenario
Figure 2: Simulated Mortgage Volume (per cent) across households in distress whereby core-FM exceeds 0.70 under baseline and adverse scenarios

Source: Household Finance and Consumption Survey.
Note: Survey weights applied. Household classified as under distress when core-FM (debt+ essential consumption) exceeds 0.7. Mortgage volume shares calculated as the ratio of total outstanding mortgage across distress households over all households. Scenarios on real GVA growth from the EBA to employment income.
Accessibility: Get the data in accessible format. (CSV 0.84KB)
The microsimulation results under the adverse scenario suggests a more salient increase in outstanding mortgages held by households in financial distress, with the share increasing by 2.3 p.p. overall. A limitation of the simulation is that it doesn’t account for divergence in income across households, which would be the case when some enter unemployment. Nevertheless, the results reflect the improved financial position highlighted in the previous section and show that the majority of households can withstand a shock to employment income and living expenses.
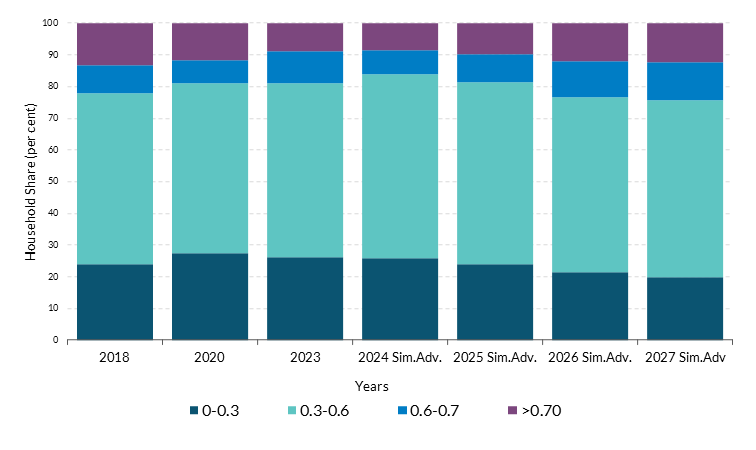
The modest increase in the share of distressed mortgages is likely explained by the strong starting position of most households. As shown in Figure 3, in 2023 there is a relatively small proportion of borrowers with core-FM in the vulnerable range of 0.6 to 0.7 – this tells us that the majority of households would require an extremely severe shock to income or expenses to push core-FM beyond the threshold. While the microsimulation shows that between 2025-2027 there is a growing share of borrowers with core-FM close to 0.7, most maintain significant headroom relative to the distressed threshold. The distribution in Figure 3 suggests that financial buffers of households limit the extent to which mortgages at-risk increase in the adverse scenario.
Proportion of households in vulnerable range of core-FM (0.6-0.7) remains significantly lower, as compared to around 80 per cent households with core FM less than 0.6
Figure 3: Distribution of households across core-FM buckets from 2018-2023 and adverse microsimulation scenarios in 2025-2027

Source: Household Finance and Consumption Survey.
Note: Survey weights applied. Adverse scenario on real GVA growth from the EBA to employment income.
Accessibility: Get the data in accessible format. (CSV 1.59KB)
While there is a projected rise in mortgages at risk, it would occur from a historically low base and remains well below crisis-era peaks (appx. 16 per cent in 2013), indicating broad systemic resilience to a downturn featuring an escalation of geopolitical risk.
Are there any differences across income groups?
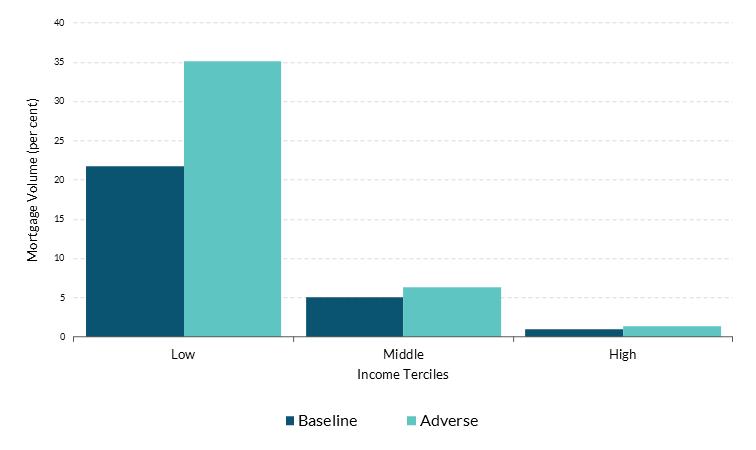
The microsimulation results show clear differences across income groups with regards to the extent of financial distress. Figure 4 presents the share of outstanding mortgage debt held by distressed households by income tercile for 2026. The results indicate that lower-income households are significantly more likely to experience financial distress than middle or high-income households. However, the share of low-income borrowers with core-FM above the threshold in the adverse scenario is still smaller than it was in the 2018 wave, highlighting the improved resilience position among low-income borrowers.
Significant difference in debt-in-distress for low-income households
Figure 4: Simulated Mortgage Volume (per cent) by Income terciles across Households in Distress (2026)

Source: Household Finance and Consumption Survey.
Note: Survey weights applied. Mortgage volume shares calculated as the ratio of total outstanding mortgage across distress households over all households in each income terciles respectively. Household classified as distressed when core-FM (debt payment + essential consumption) exceeds 0.7. Scenarios on real GVA growth from the EBA to employment income.
Accessibility: Get the data in accessible format. (CSV 3.48KB)
Middle-income households also experience some increase in their financial strain, but to a much lesser extent than the lowest income group owing to their higher disposable income. Compared to these, the high-income households remain largely insulated from financial distress by virtue of stronger balance sheets providing greater flexibility to adjust spending. In practical terms, this means that the financial stress caused by the adverse scenario would be concentrated among households with low-income, with the share of mortgage at risk in the bottom third reaching 35 per cent.
While our simulation analysis is only based on a single adverse scenario and cannot capture all transmission channels (e.g. we primarily shock income rather than unemployment) our findings still support financial stability assessments. For low-income households, a rise in distress to 35 per cent would increase the risk of arrears, but the shock to income and cost-of-living expenses would only bring distress rates back to 2018 levels. Furthermore, given that only 7.6 per cent of outstanding mortgage are held by these households in 2023 (HFCS, 2022-2023), the risk to the financial system is limited.
Overall, the results suggest that while the mortgage market remains largely resilient, the impact of this adverse shock would not be evenly distributed. Low-income households would face the greatest difficulty, underscoring the need for continued monitoring of vulnerabilities within this segment.
Conclusion
This Insight studies the impact of a macroeconomic stress, based on the EBA scenarios for sectoral GVA changes, inflation and mortgage interest rate, on household borrower resilience. Using most recent HFCS data, we conduct a micro-simulation analysis and show that household risks remain contained, with stable financial margins between 2025 and 2027, indicating broadly sustainable repayment capacity. Under the adverse scenario, the share of mortgage at risk could rise relative to the 2024 level, from 6.4 to 8.7 per cent. While there is a projected rise in mortgages at risk, it would occur from a historically low base and remains well below crisis-era peaks. Financial strain is concentrated at the lower end of the income distribution, where narrow financial margins leave households more vulnerable to further cost or income shocks.
References
Adhikari, T., and Yao, F. (2023) Household resilience to expenditure and debt service channels under current inflationary conditions. Financial Stability Notes, No. 3 Vol. 2023, Central Bank of Ireland.
Ampudia, M., Van Vlokhoven, H. and ˙Zochowski, D. (2016), Financial fragility of euro area households, Journal of Financial Stability 27, 250–262.
Bank of England (2023), ‘How are the rising cost of living and interest rates affecting households’ ability to pay their mortgage’, Bank Overground.
Central Bank of Ireland (2019). Financial Stability Review 2019:I, Central Bank of Ireland.
Central Bank of Ireland (2020). Financial Stability Review 2020:I, Central Bank of Ireland.
Central Bank of Ireland (2021). Financial Stability Review 2021:II, Central Bank of Ireland.
Central Bank of Ireland (2022). Financial Stability Review 2022:I, Central Bank of Ireland.
Central Bank of Ireland (2023). Financial Stability Review 2023:I, Central Bank of Ireland
Central Bank of Ireland (2024). Financial Stability Review 2024:II, Central Bank of Ireland.
Central Bank of Ireland (2025). Signed Article, Vol.2025 No. 3, Central Bank of Ireland.
Jappelli, T., Pagano, M. and Di Maggio, M. (2013), ‘Households’ indebtedness and financial fragility’, Journal of Financial Management, Markets and Institutions 1(1), 23–46.
Lukmanova, E., O’Grady, M. (2025) The Sectoral Impacts of Tariffs and Trade Fragmentation in the Irish Economy. Staff Insight, No. 2, Vol. 2025, Central Bank of Ireland.
Michelangeli, V. and Pietrunti, M. (2014), ‘A microsimulation model to evaluate Italian households’ financial vulnerability’, Bank of Italy, Occasional Paper (225).
Valderrama, L., Gorse, P., Marinkov, M. and Topalova, P. B. (2023), ‘European housing markets at a turning point–risks, household and bank vulnerabilities, and policy options’, IMF Working Paper.