Key Insights
This Staff Insight presents a new framework for monitoring price pressures along the supply chain, helping to identify in advance which consumer categories are likely to experience price movements and the mechanisms driving them, with a particular focus on imported energy shocks.
The 2026 energy shock (the oil-price spike that followed the US-Iran conflict and the threat to the Strait of Hormuz) is clearly visible in the data, but broader supply-chain pass-through remains limited so far against a backdrop of persistent domestic non-energy inflation.
Applied to the adverse and severe oil and gas price scenarios included in the Q2 2026 Quarterly Bulletin, the framework implies increases of approximately 1.7 and 5.0 per cent in the HICP price level under full cost pass-through. These are static estimates, rather than forecasts, relating solely to the increase in energy costs. Roughly one quarter of the estimated increase in price level comes indirectly via the supply chain of non-energy goods and services.
Introduction
Ireland’s Exposure to Imported Energy
Irish inflation reflects the interaction of global and domestic forces. As a small open economy with a high import dependence, movements in international energy prices transmit into consumer prices in Ireland quickly and visibly. The 2022 inflation surge was dominated by energy price increases following Russia's invasion of Ukraine. The subsequent phase shifted towards persistent services inflation as earlier shocks passed into wages, rents and locally priced services (Figure 1). In recent months of 2026, energy prices have re-emerged as a key driver of inflation.
The 2022 Energy Shock Demonstrated how Quickly External Price Movements can Feed into Irish Inflation
Figure 1: Percentage Point Contributions to Year-on-year Headline Inflation
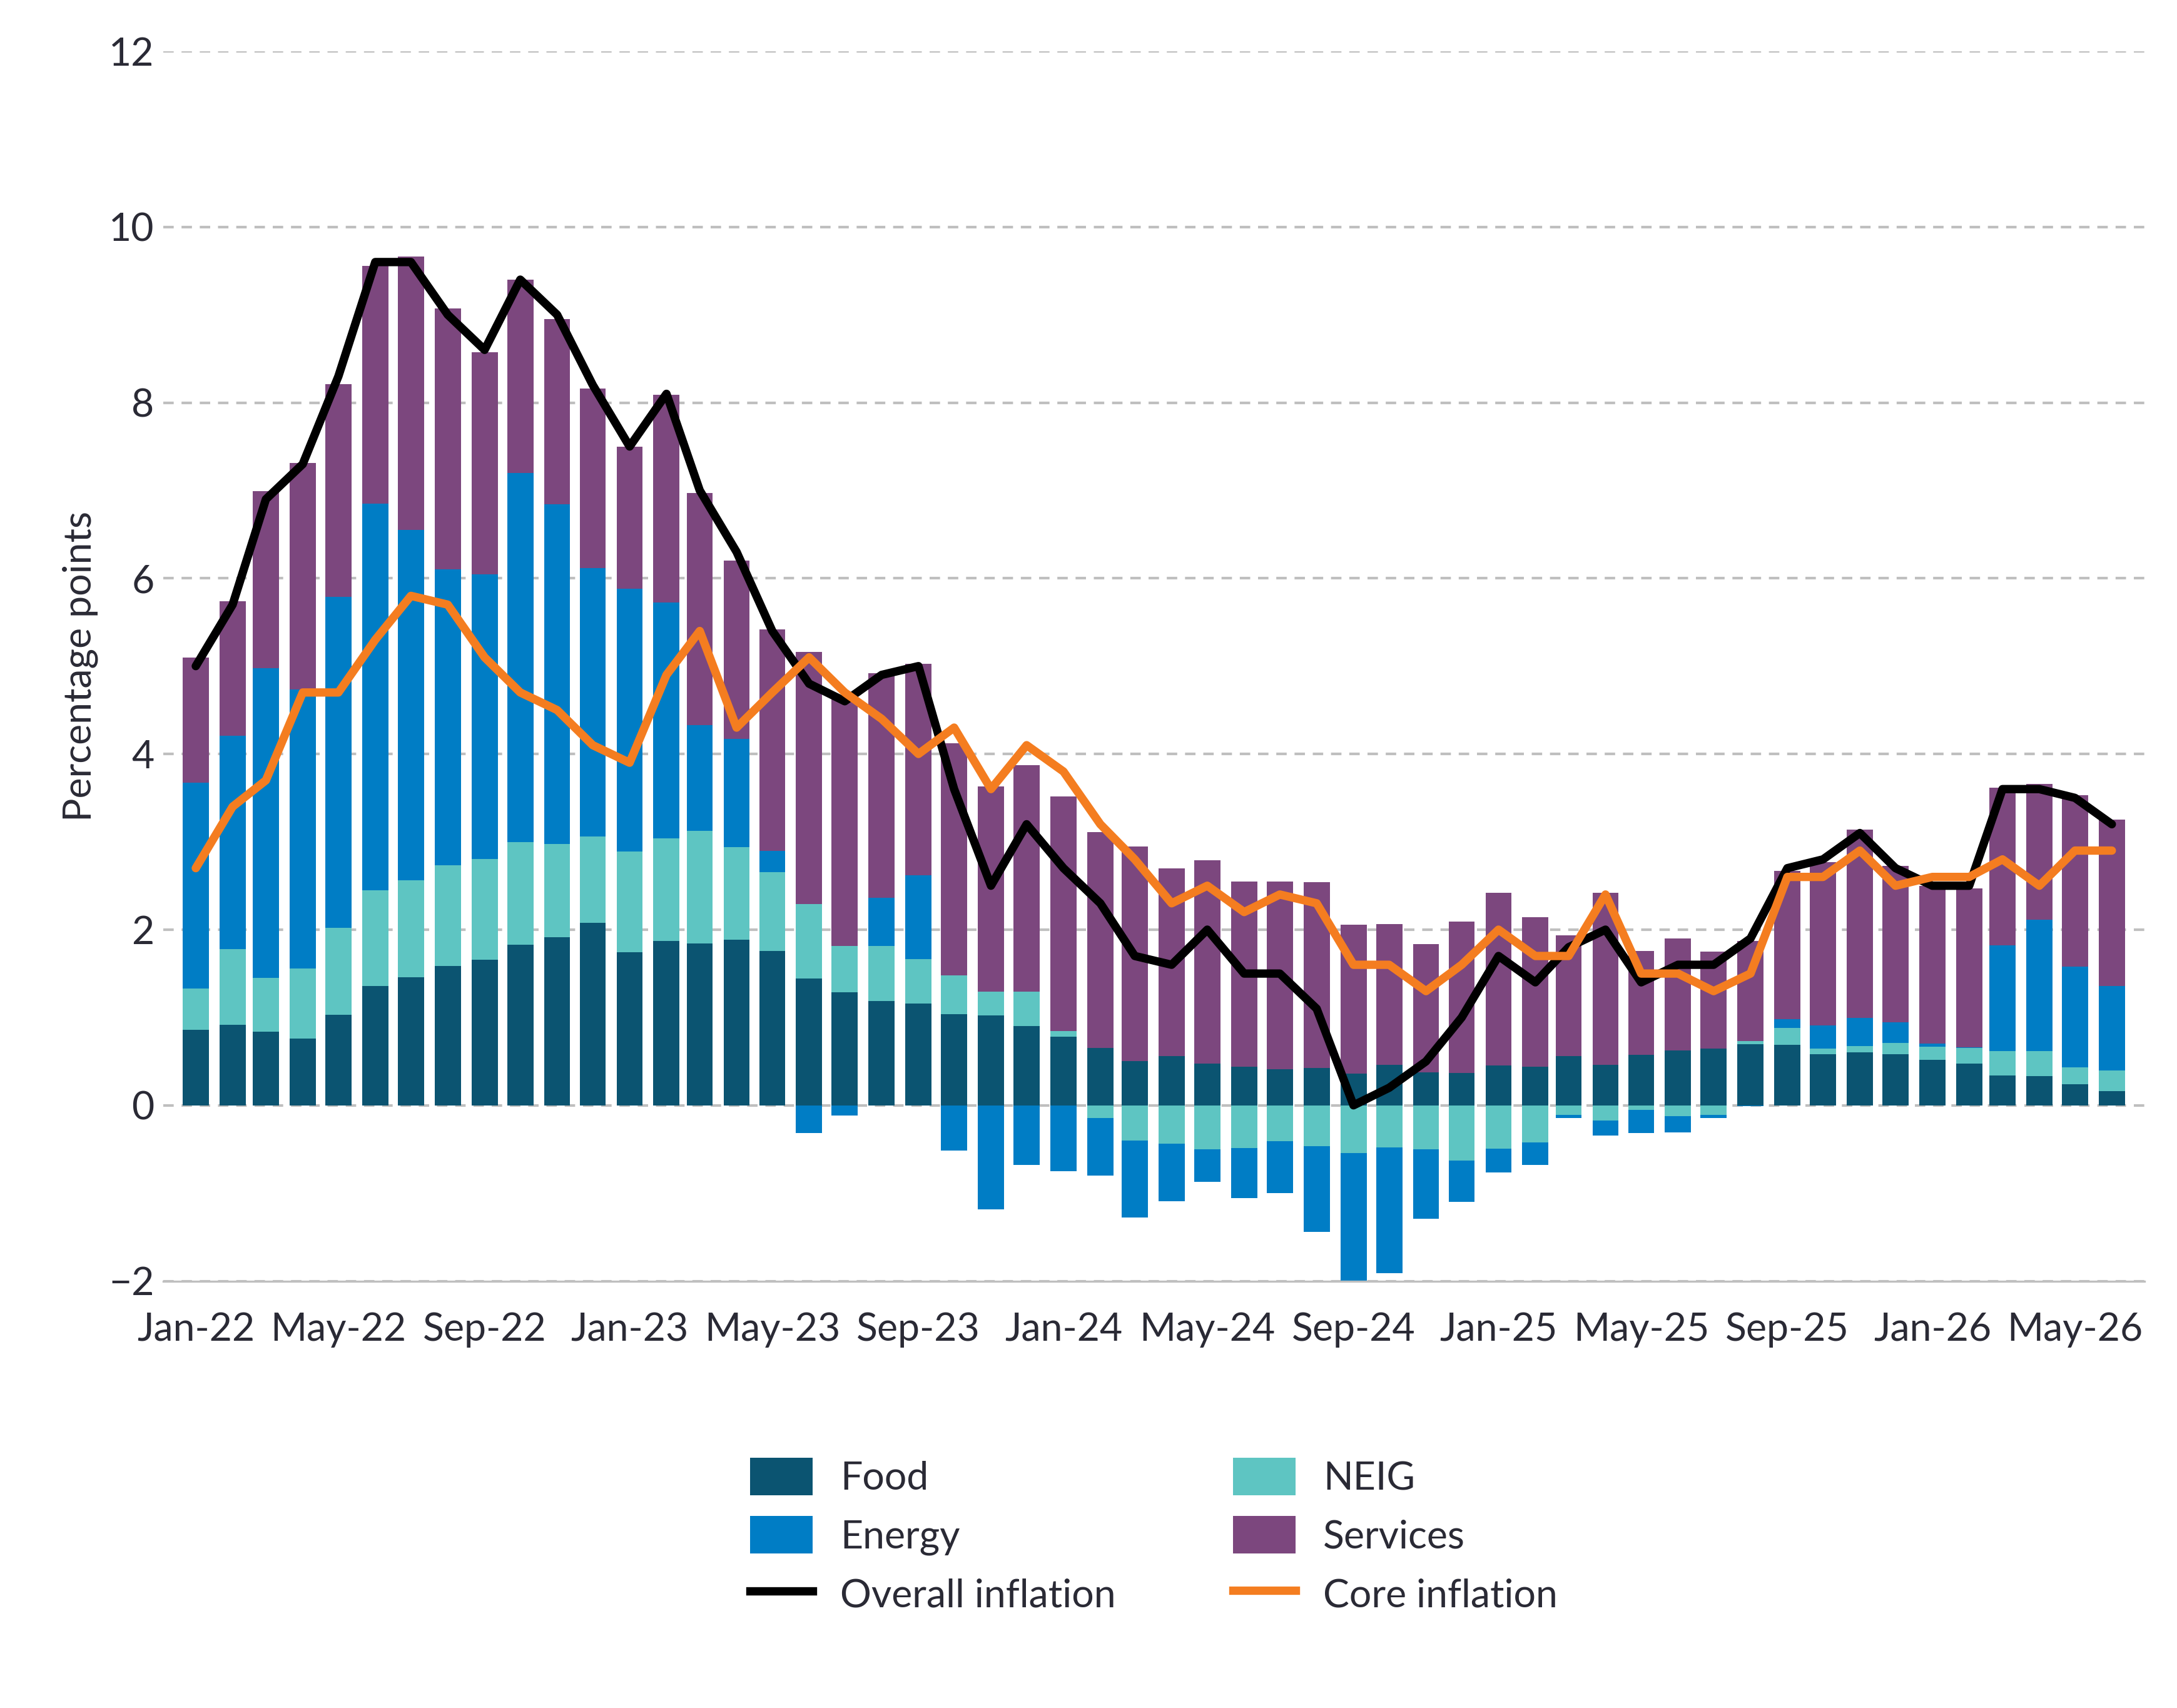
Source: CSO. Chart data in accessible format (XLSX 48.28KB).
Annual HICP inflation stood at 3.2 per cent in June 2026, having peaked at 3.6 per cent in March and April, with energy prices up 10 per cent year-on-year. Unlike the 2022 energy shock, the present shock is predominantly evident in oil, rather than gas prices. Ireland relies more heavily on home heating oil than our euro area peers (over two times larger based on share of total consumption), which rose 80 per cent in the year to April 2026, while motor fuel increased by 17 per cent, before easing considerably - to 49 and 11 per cent respectively by June - following the Government’s excise cut and the retreat in oil prices. Although wholesale gas prices have risen since the start of the US-Iran conflict, Irish retail gas prices remain broadly flat (+0.2 per cent in the year to June 2026) while electricity prices have picked up somewhat (+4.2 per cent). The mid-2026 disruption to the safe passage of crude oil through the Strait of Hormuz had direct implications for businesses and for household living costs, and, consequently, the level of real activity in the Irish economy - and the risk of renewed disruption remains. Understanding the potential implications of a more prolonged conflict on broader categories of Irish consumer prices is therefore essential.
This Insight decomposes Irish HICP inflation into domestic and imported components, and into energy and non-energy content, by tracing the full supply chain embedded in each good and service. We examine where global energy shocks show up first, whether recent inflation is predominantly imported or domestic, and which categories are most exposed when an external shock arrives. We then apply the framework to the adverse and severe oil and gas price scenarios from the Central Bank’s Q2 2026 Quarterly Bulletin (QB) and display a tool developed for ongoing monitoring of energy-price-induced cost-push inflation.
Building the Framework
Data Sources and Methodology
The framework integrates three complementary data sources. First, Harmonised Index of Consumer Prices (HICP) data from the Central Statistics Office (CSO) provides monthly prices and weights for 94 item-level categories for Ireland. Second, Eurostat's FIGARO inter-country input-output (I/O) tables – roughly 3,200 country-product nodes spanning about 50 countries and 64 product groups – map each item back into the global production network at basic prices. Third, the CSO Supply-Use and Input-Output Tables (SUTs) then supply the Ireland-specific purchaser-price wedge, which includes the combined trade margin (wholesale, transport and retail) plus taxes on products.
The method proceeds in three steps. First, we build a classification bridge that maps each HICP item onto the corresponding FIGARO I/O and CSO SUT tables’ products. Second, we use a standard input-output technique to trace every euro of household spending back through the entire production network at basic prices, including the energy consumed several stages upstream. A separate CSO supply-use wedge then adds the Irish trade and transport margins and product taxes that sit between basic and purchaser prices. Third, we isolate domestic and energy-producing nodes to determine each item's origin and energy content, then apply item-level weights to monthly price changes to decompose inflation at the HICP level. In effect, the method follows each euro through every supplier, and every supplier’s own supplier, so that energy used several stages upstream is captured, not just the energy a product uses directly. The framework measures this mechanical cost-push exposure and abstracts from behavioural responses such as demand adjustment, margin absorption or policy supports, so the scenario results reported below are a compliment to – rather than a substitute for – other inflation forecasts produced by the Central Bank.
This approach is related to a small but growing literature that uses input-output and supply-use tables to distinguish imported from domestically generated inflation and to trace cost shocks through production networks. For the UK, Dhingra (2023) and Dhingra and Page (2023) show how the terms-of-trade shock fed into CPI inflation through energy, import and indirect supply-chain channels. For the euro area, the ECB’s low import intensity, or LIMI, indicator applies a similar import-intensity logic to HICP items, using direct and indirect import content to isolate price pressures that are more domestically generated. Recent academic work using sectoral producer prices, notably Chau et al. (2026), shows how inflation shocks propagate through global value chains and input-output linkages, while Schneider (2025) provides a closely related HICP decomposition for Austria.
From Producer Prices to Consumer Prices: Decomposing the Price Wedge
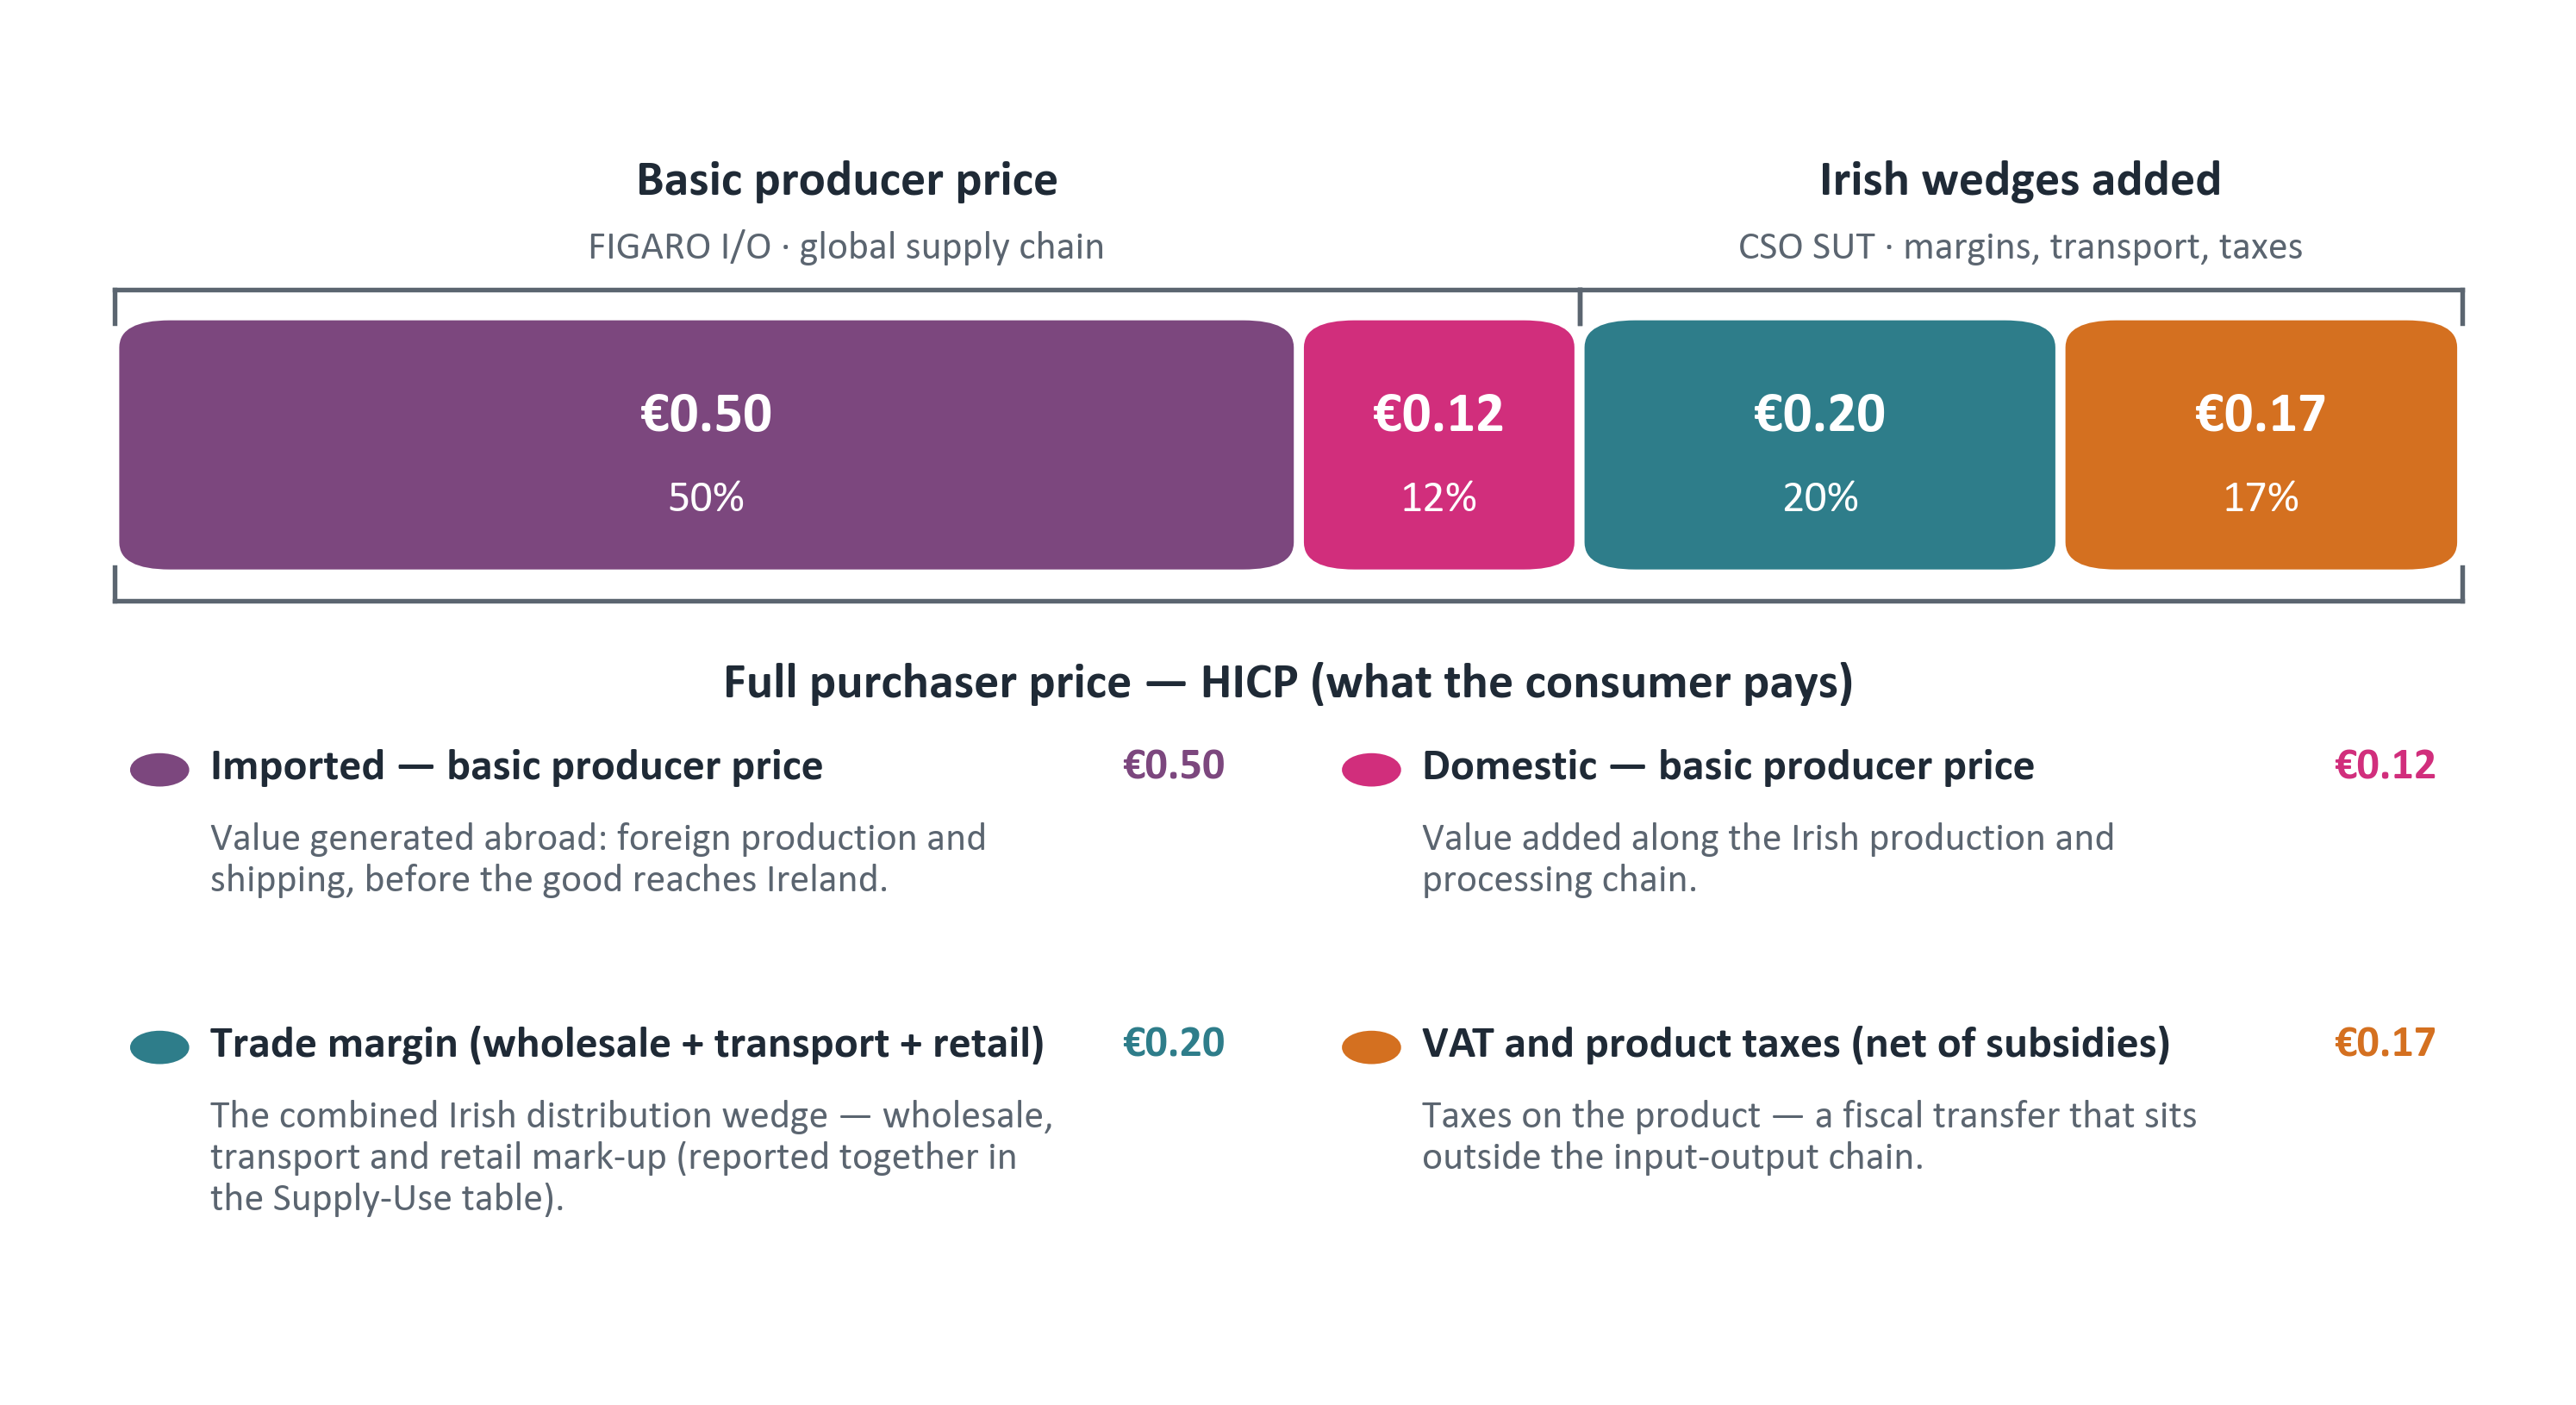
FIGARO operates in basic prices while households pay purchaser prices. The CSO Supply-Use tables calibrate the wedge between these two measures, comprising the combined trade margin plus VAT and product taxes. For example, of every euro spent on consumer transport goods (mainly motor vehicles), approximately half represents the imported basic price, 12 cents is Irish value added, one fifth is the combined trade margin (wholesale, transport and retail), and 17 cents is tax (Figure 2). The degree of additional non-energy related value-added throughout the global production and domestic delivery process helps determine the potential scale of energy-induced cost-push inflation at a goods category level on final consumer prices.
Inside €1 of a Consumer Price – a Worked Example (Consumer Transport Goods)
Figure 2: Decomposition of €1 of Household Spending on Consumer Transport Good
Source: CSO and Eurostat. Chart data in accessible format (XLSX 48.28KB).
Note: we use the broader category of consumer transport goods for this example, which is dominated by motor vehicles. The 17 cents of tax is the category average, a new car alone would be higher, since Vehicle Registration Tax is levied on top of the standard 23 per cent VAT.
The wedge varies enormously across categories (Figure 3). Apparel is dominated by the combined trade margin (roughly 50 cents of every euro); alcohol and tobacco by tax (44 cents per euro); most grocery spending is basic price with only a few cents of VAT. Decomposing the basic price shows that approximately half of every euro spent on electricity and gas, and 68 cents of every euro spent on transport services is imported basic price. Motor and heating fuel, by contrast, carries the largest tax wedge at about 41 cents of excise, carbon tax and VAT per euro (for motor fuel alone the tax share exceeds half), in-part reflecting government policy to address the negative environmental externalities associated with carbon-emitting fuels.
Decomposing Final Consumer Prices Across Goods and Services Categories
Figure 3: Each Category Split into Imported and Domestic Basic Price, Trade Margin, and Product Taxes at Consumer-Category Level
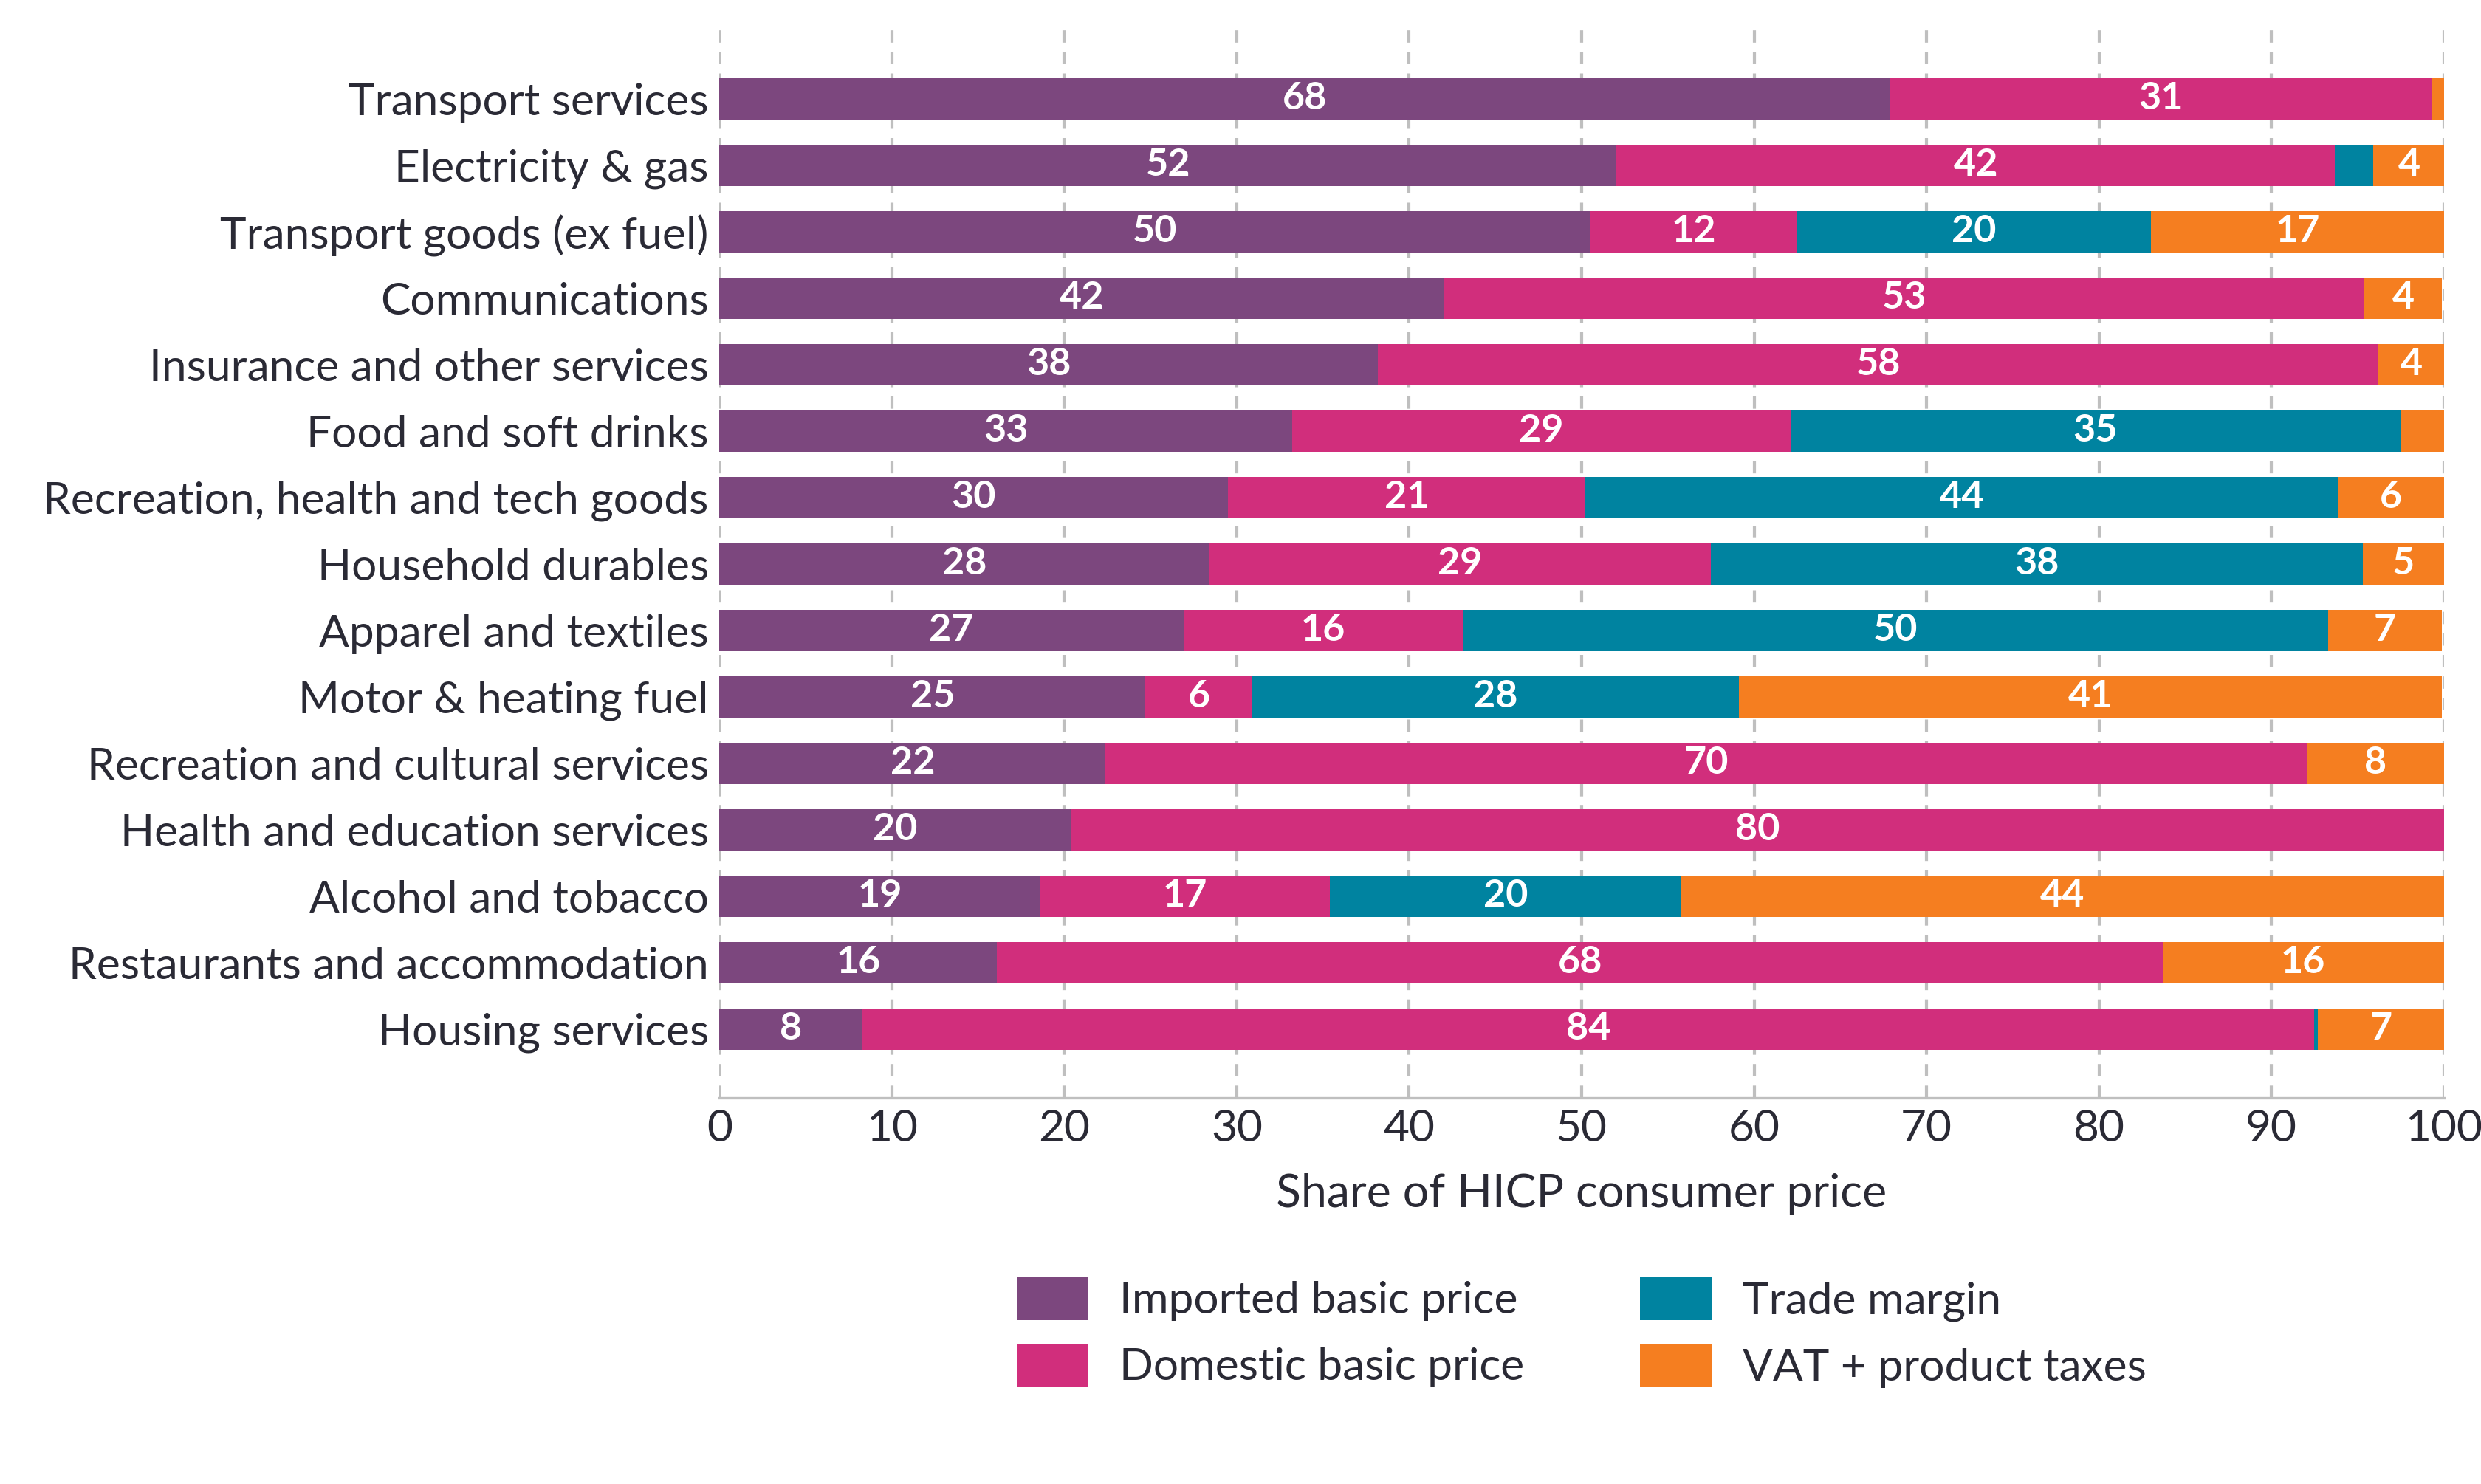
Source: CSO, Eurostat and author calculations. Chart data in accessible format (XLSX 48.28KB).
Where Energy Enters the Supply Chain
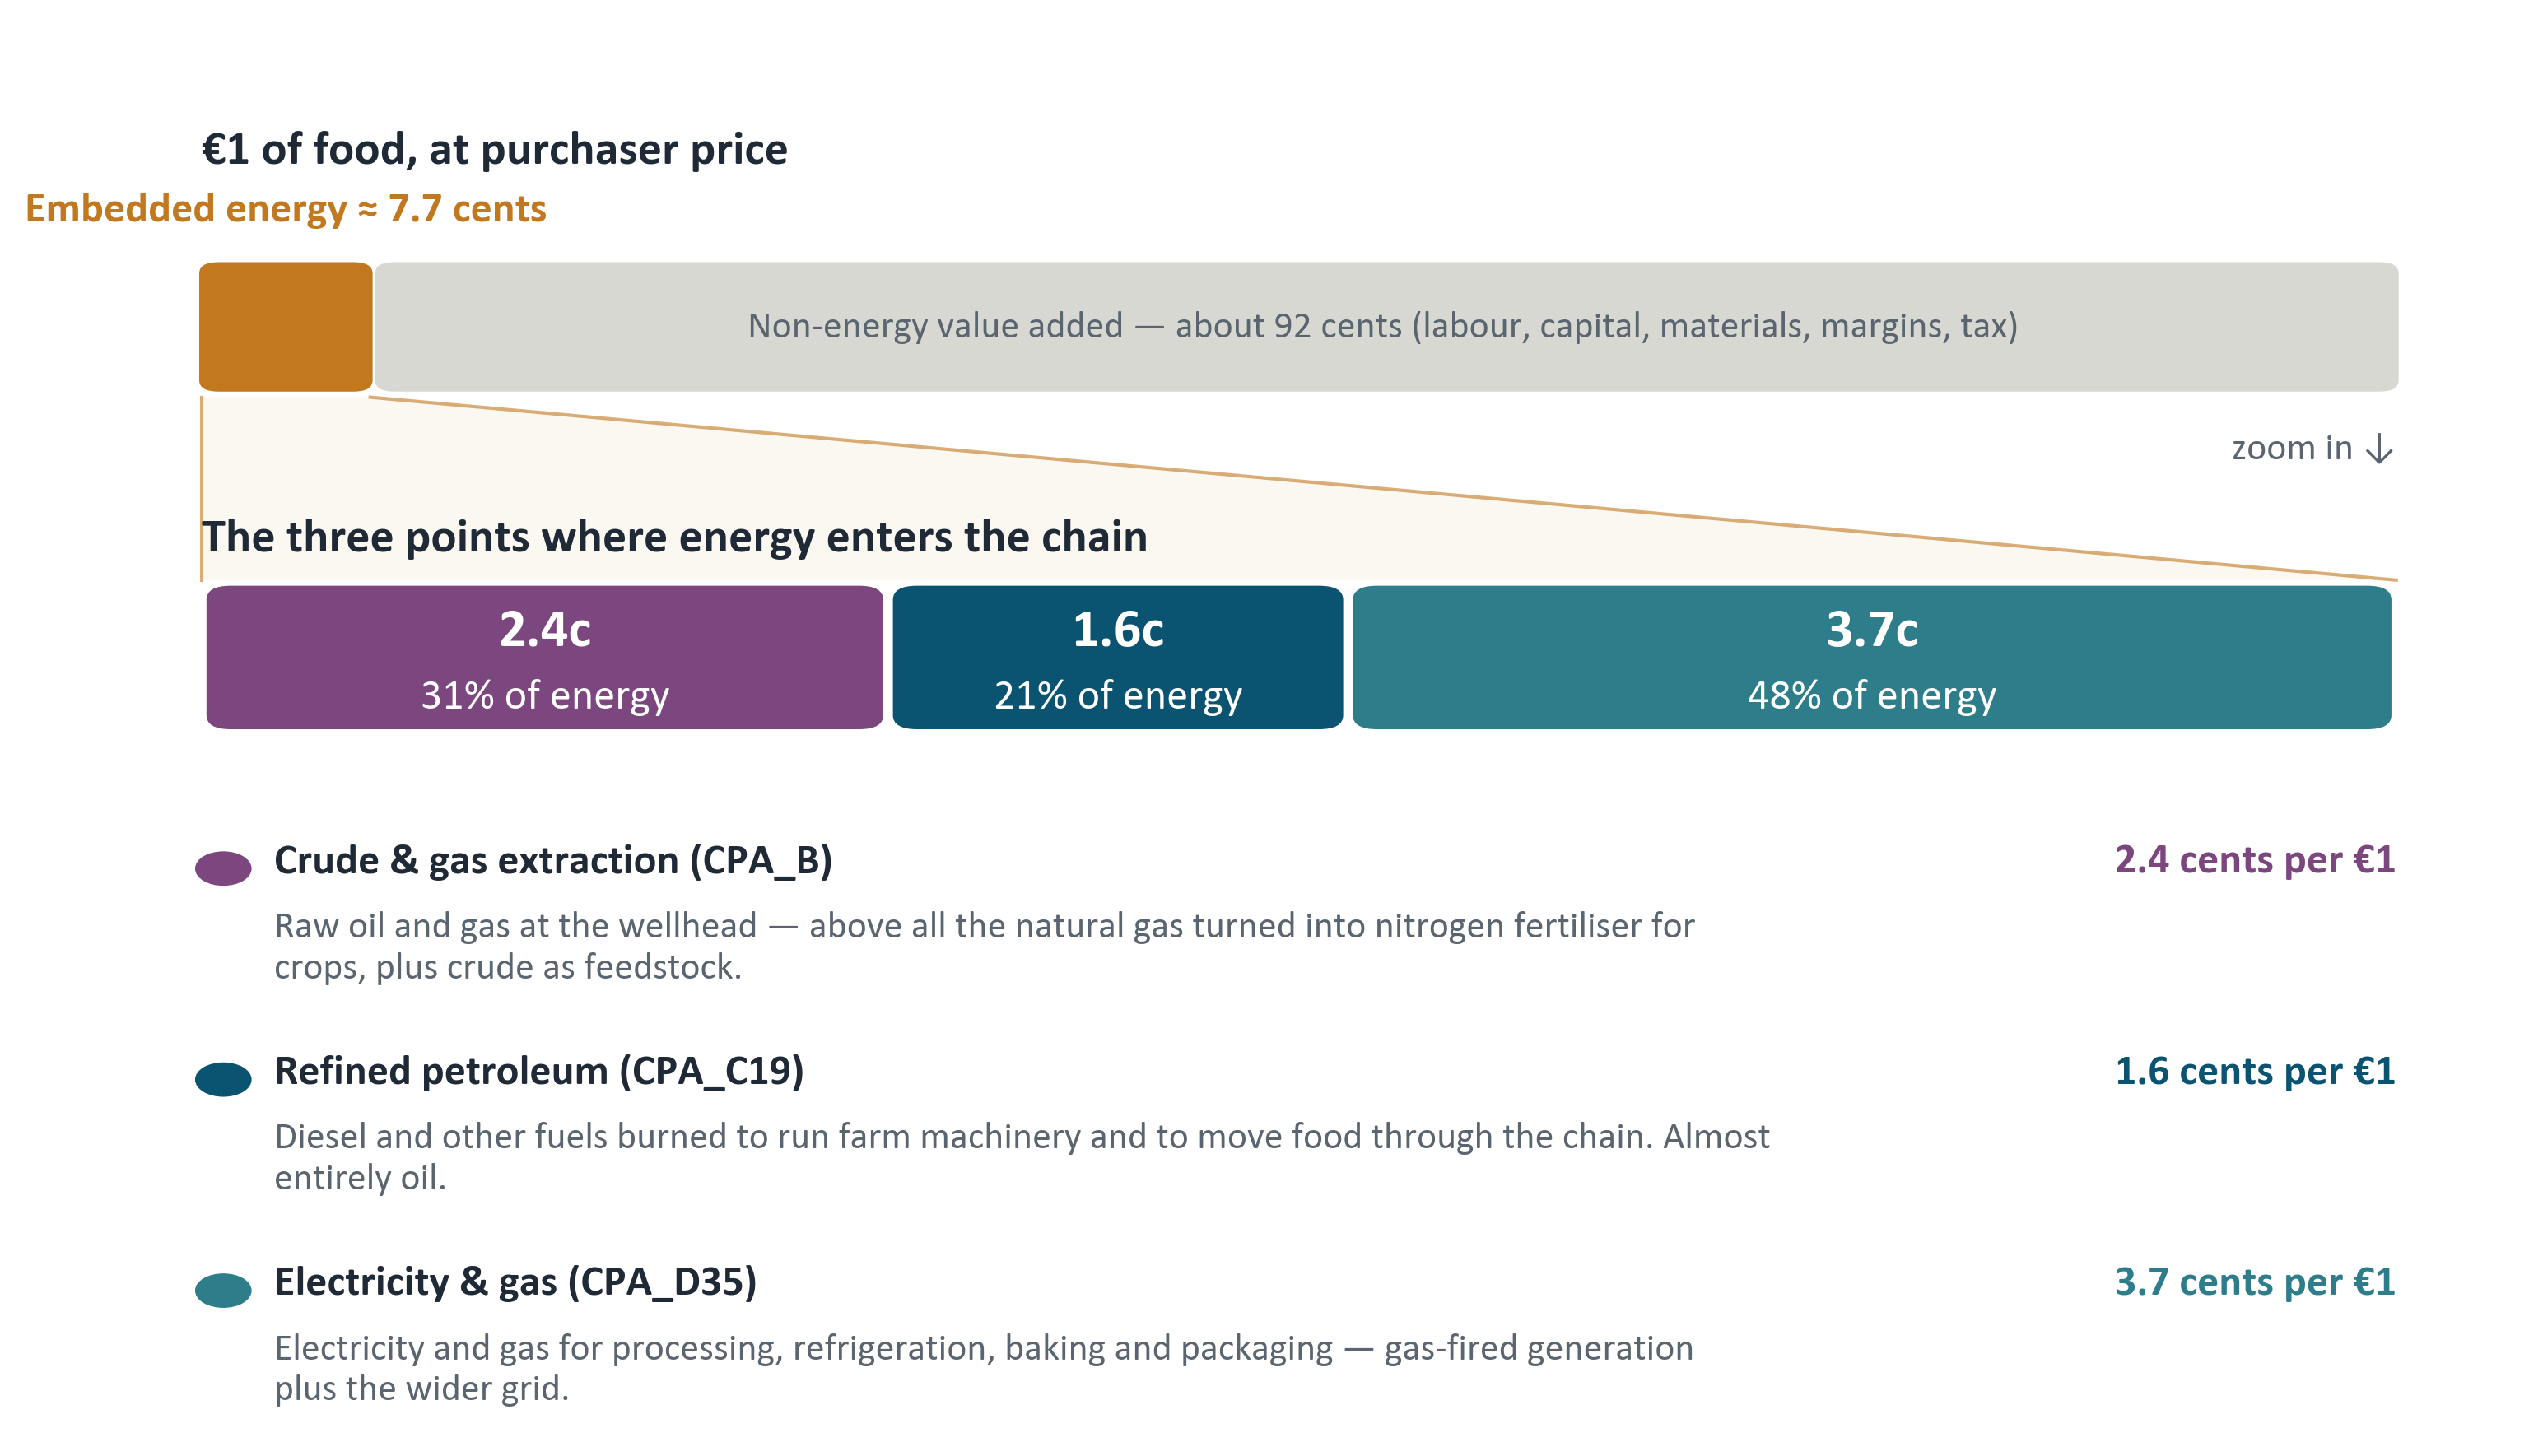
Through the lens of the I/O and SUT tables, energy enters a consumer good at three points, corresponding to the three energy-producing sectors through which the supply-chain runs. These include crude and gas extraction (for example natural gas turned into nitrogen fertiliser), refined petroleum (such as diesel and fuels that power manufacturing machinery and goods transport), and electricity and gas utilities (such as the power for processing and refrigeration). Many goods categories draw on all three energy sources in some form during production and distribution.
(Figure 4) demonstrates this for the general food and non-alcoholic beverages category. For every euro of final demand for food, about 7.7 cents is embedded energy, comprising 3.7 cents from electricity and gas, 2.4 cents from extraction and 1.6 cents from refined fuel. These 7.7 cents are cumulative energy purchases along the supply chain (the same energy is counted at each stage it changes hands, so there is some double counting); counted once, as energy-sector value added, food’s embedded energy is lower at around 3 cents per euro.
Where Energy Enters €1 of Food – the Three Points in the Supply Chain
Figure 4: Category Average Share of Embedded Energy for Food and Non-alcoholic Beverages
Source: CSO, Eurostat and author calculations.Chart data in accessible format (XLSX 48.28KB).
Decomposing Inflation: Imported vs Domestic, Energy vs Non-energy
Applying the framework from 2019 to 2026 reveals both the volatility of imported energy and the persistence of domestic non-energy inflation. Throughout the analysis, energy is measured on an integrated supply chain basis by combining the direct household energy bill with the energy embedded in producing all other goods and services and split, like the rest of the basket, into imported and domestic content.
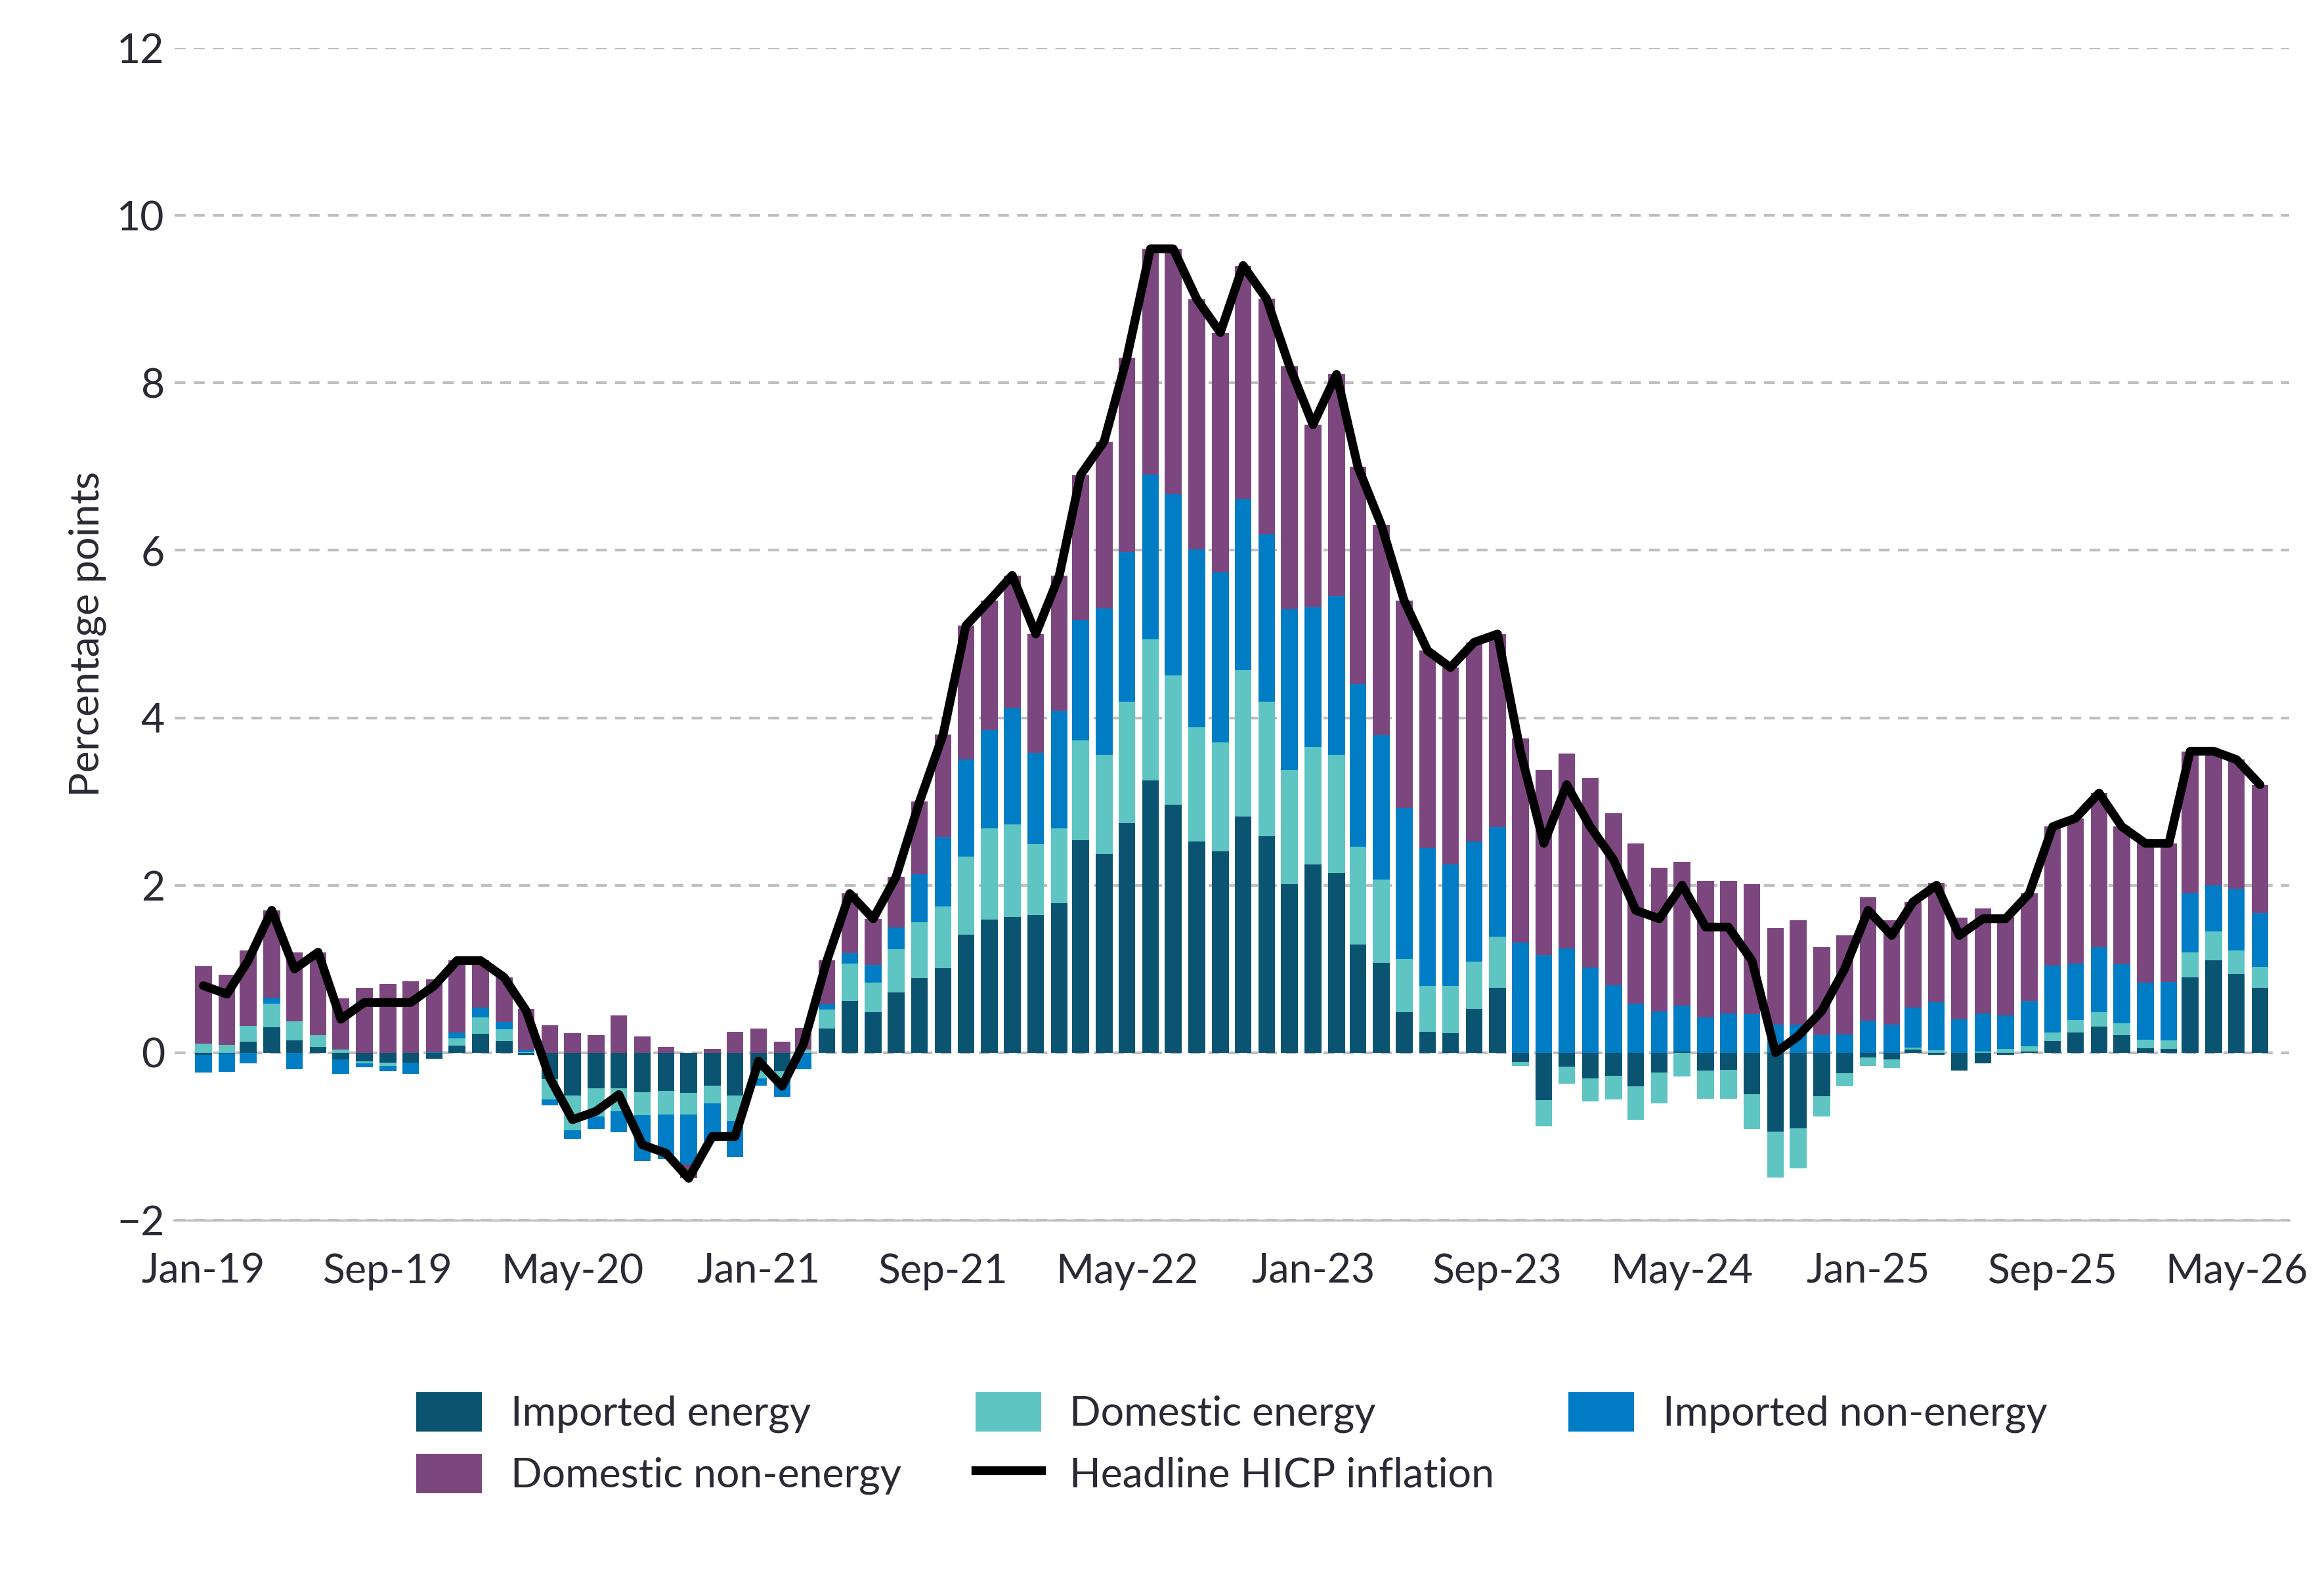
At the 2022 peak (June 2022), when annual HICP reached 9.6 per cent, imported and domestic energy together contributed approximately 4.9 percentage points, with imported non-energy goods adding a further 2 percentage points. Domestic non-energy content had risen materially by 2021/22, made a substantial contribution at the 2022 peak and remained persistently positive as energy prices normalised and earlier shocks fed into wages and rents. By late 2025, headline inflation of approximately 2.7 per cent was led by domestic non-energy content (1.6 percentage points), with energy and imported non-energy together contributing approximately 1 percentage point. Early 2026 marks a turning point, by April, headline inflation had climbed back to 3.6 per cent and imported energy had jumped to around 1.1 percentage points – the clearest sign in the data that the renewed oil-price spike is again reaching Irish prices through imports. Headline inflation then eased to 3.5 per cent in May and 3.2 per cent by June, with the imported-energy contribution moderating to around 0.8 percentage points following the excise cut and the retreat in oil prices (Figure 5).
Imported vs. Domestic and Energy vs. Non-energy Decomposition of Irish HICP Inflation
Figure 5: Percentage Point Contributions to Annual Headline Inflation
Source: CSO, Eurostat and author calculations. Chart data in accessible format (XLSX 48.28KB).
Note: Energy is I/O embedded plus direct energy content
Application: Energy Exposure and the 2026 Scenarios
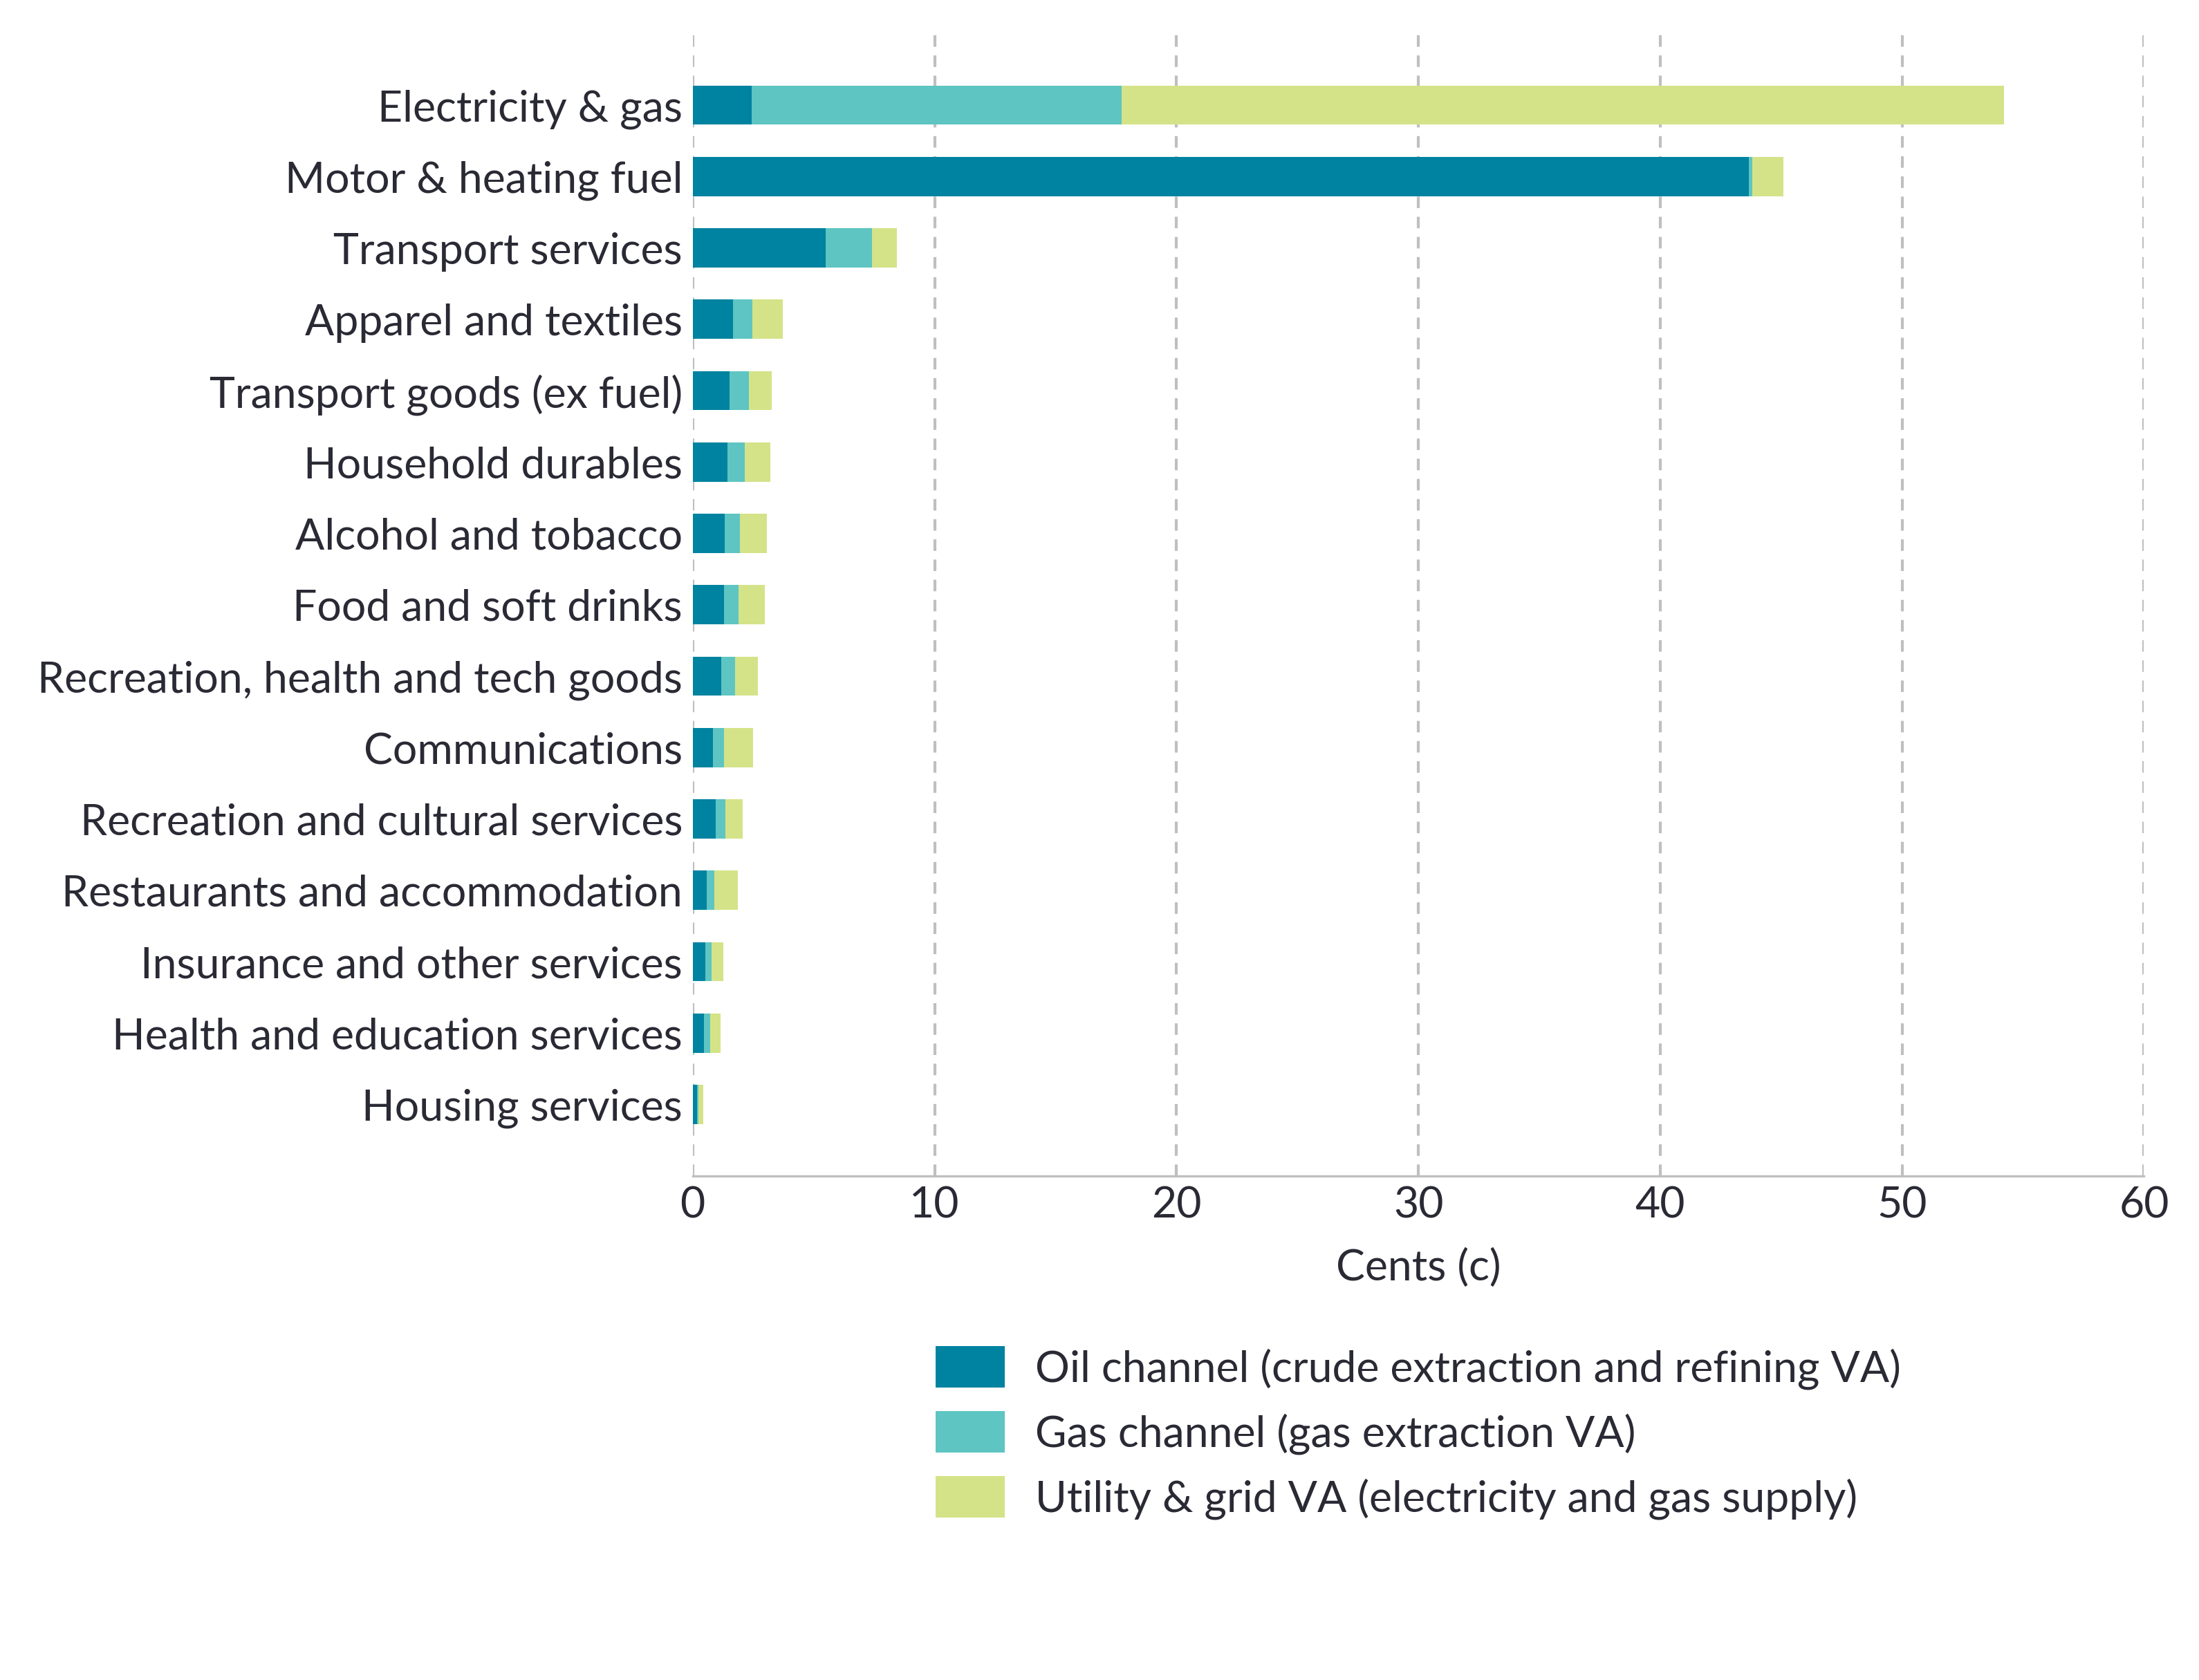
To determine which consumer price categories face the greatest exposure to the current energy shocks, (Figure 6) maps the embedded oil and gas in every category (aggregating the three entry points from Figure 4) prior to any shock being applied. Among the non-energy (indirect) goods and services, transport services stand out at approximately 8 cents of energy-sector value added per euro largely in the form of oil. Most goods contain 2-4 per cent embedded energy value added, while housing services contain less than half a per cent. The two direct-energy categories sit far above this scale at around 45 and 54 cents per euro, and their composition is informative – motor and heating fuel’s energy value added is almost entirely oil (extraction plus refining), while electricity and gas’s is mostly the utilities’ own margins with natural gas the dominant fuel, which in part explains why the former spiked in 2026 and the latter did not.
Embedded oil and gas by HICP Category in Producing €1 of Final Consumption
Figure 6: Energy-sector Value Added Embedded in €1 of Final Consumption, at Basic Price
Source: CSO, Eurostat and author calculations. Chart data in accessible format (XLSX 48.28KB).
Notes: The energy intensity of each category is the value added of the three energy-producing sectors – oil and gas extraction, refined petroleum, and electricity and gas utilities – embodied in one euro of household consumption at basic prices, traced directly and indirectly through the global production network. Because each euro of final spending decomposes exactly into value added across all sectors, these shares cannot exceed 100 per cent. Motor and heating fuel carries around 45 cents of energy-sector value added per basic-price euro (almost entirely oil extraction and refining), and electricity and gas around 54 cents, with natural gas the dominant fuel input.
How large could the cost-push shock to Irish consumer prices be if disruption to oil and gas supply through the Strait of Hormuz were to resume? We apply the framework to the adverse and severe energy-price scenarios underpinning the Q2 2026 QB. Table 1 shows the outcome of applying our framework to these scenarios’ peak price levels reached in 2026 as a static shock. Oil and gas reach USD 122 per barrel and EUR 60 per MWh in the adverse case, and USD 166 and EUR 98 in the severe case. For the supply-chain channel, the shock enters at a single point – the price of extracted oil and natural gas (split 60/40 between oil and gas based on SEAI 2023 import values) – and propagates through the global supply chain. Refined petroleum, electricity and every downstream product inherit the shock in proportion to their cumulative extraction content, so no unit of primary energy is counted twice. Household energy bills are treated separately in the direct channel, with calibrated retail pass-through fractions.
The household impact runs through both channels (Table 1). Direct energy bills rise most, especially gas and home heating oil, while indirect increases are smaller and led by transport services. In aggregate, the adverse and severe cases imply eventual first-round increases of approximately 1.7 and 5.0 per cent in the HICP price level, with roughly three-quarters of each effect arising through the direct channel.
Using the same underlying oil and gas scenario paths, but including the full quarterly profiles in a dynamic framework, Quarterly Bulletin 2 2026 included estimates of annual-average HICP deviations from its 3.5 per cent central inflation forecast of +0.3 (adverse) and +0.9 (severe) percentage points in 2026, with the severe deviation continuing to build to 1.9 percentage points in 2027. These estimates were derived using the Bank’s semi-structural macroeconomic models and differ from the estimates produced using this methodology. As a result, this analysis should be read alongside the Bank's inflation projections rather than as substitutes for them.
Estimated Cost Increase by Consumer Price Category and Implied First-round HICP Price-level Effect
Table 1: Increase in Costs by Consumer Price Category Under the Q2 2026 QB Adverse and Severe Energy-price Paths
| Adverse | Severe |
|---|
| Direct — household energy bills (% rise) | | |
| Gas | +17 | +55 |
| Electricity | +12 | +40 |
| Home heating oil | +18 | +42 |
| Motor fuel | +11 | +27 |
| Indirect — embedded energy in other categories (% rise) | | |
| Transport services | +2.0 | +5.5 |
| Apparel and textiles | +0.9 | +2.5 |
| Transport goods (excl. fuel) | +0.9 | +2.4 |
| Household durables | +0.8 | +2.2 |
| Alcohol and tobacco | +0.7 | +1.9 |
| Food and soft drinks | +0.7 | +1.8 |
| Recreation, health and tech goods | +0.6 | +1.7 |
| Communications | +0.5 | +1.3 |
| Recreation and cultural services | +0.4 | +1.2 |
| Restaurants and accommodation | +0.3 | +0.9 |
| Insurance and other services | +0.3 | +0.7 |
| Health and education services | +0.3 | +0.7 |
| Housing services | +0.1 | +0.2 |
| Contribution to the estimated first-round HICP price-level increase (percentage points) | | |
| Direct channel | +1.3 | +3.7 |
| Indirect channel | +0.5 | +1.4 |
| Total | +1.7 | +5.0 |
An Energy Price Monitoring Framework
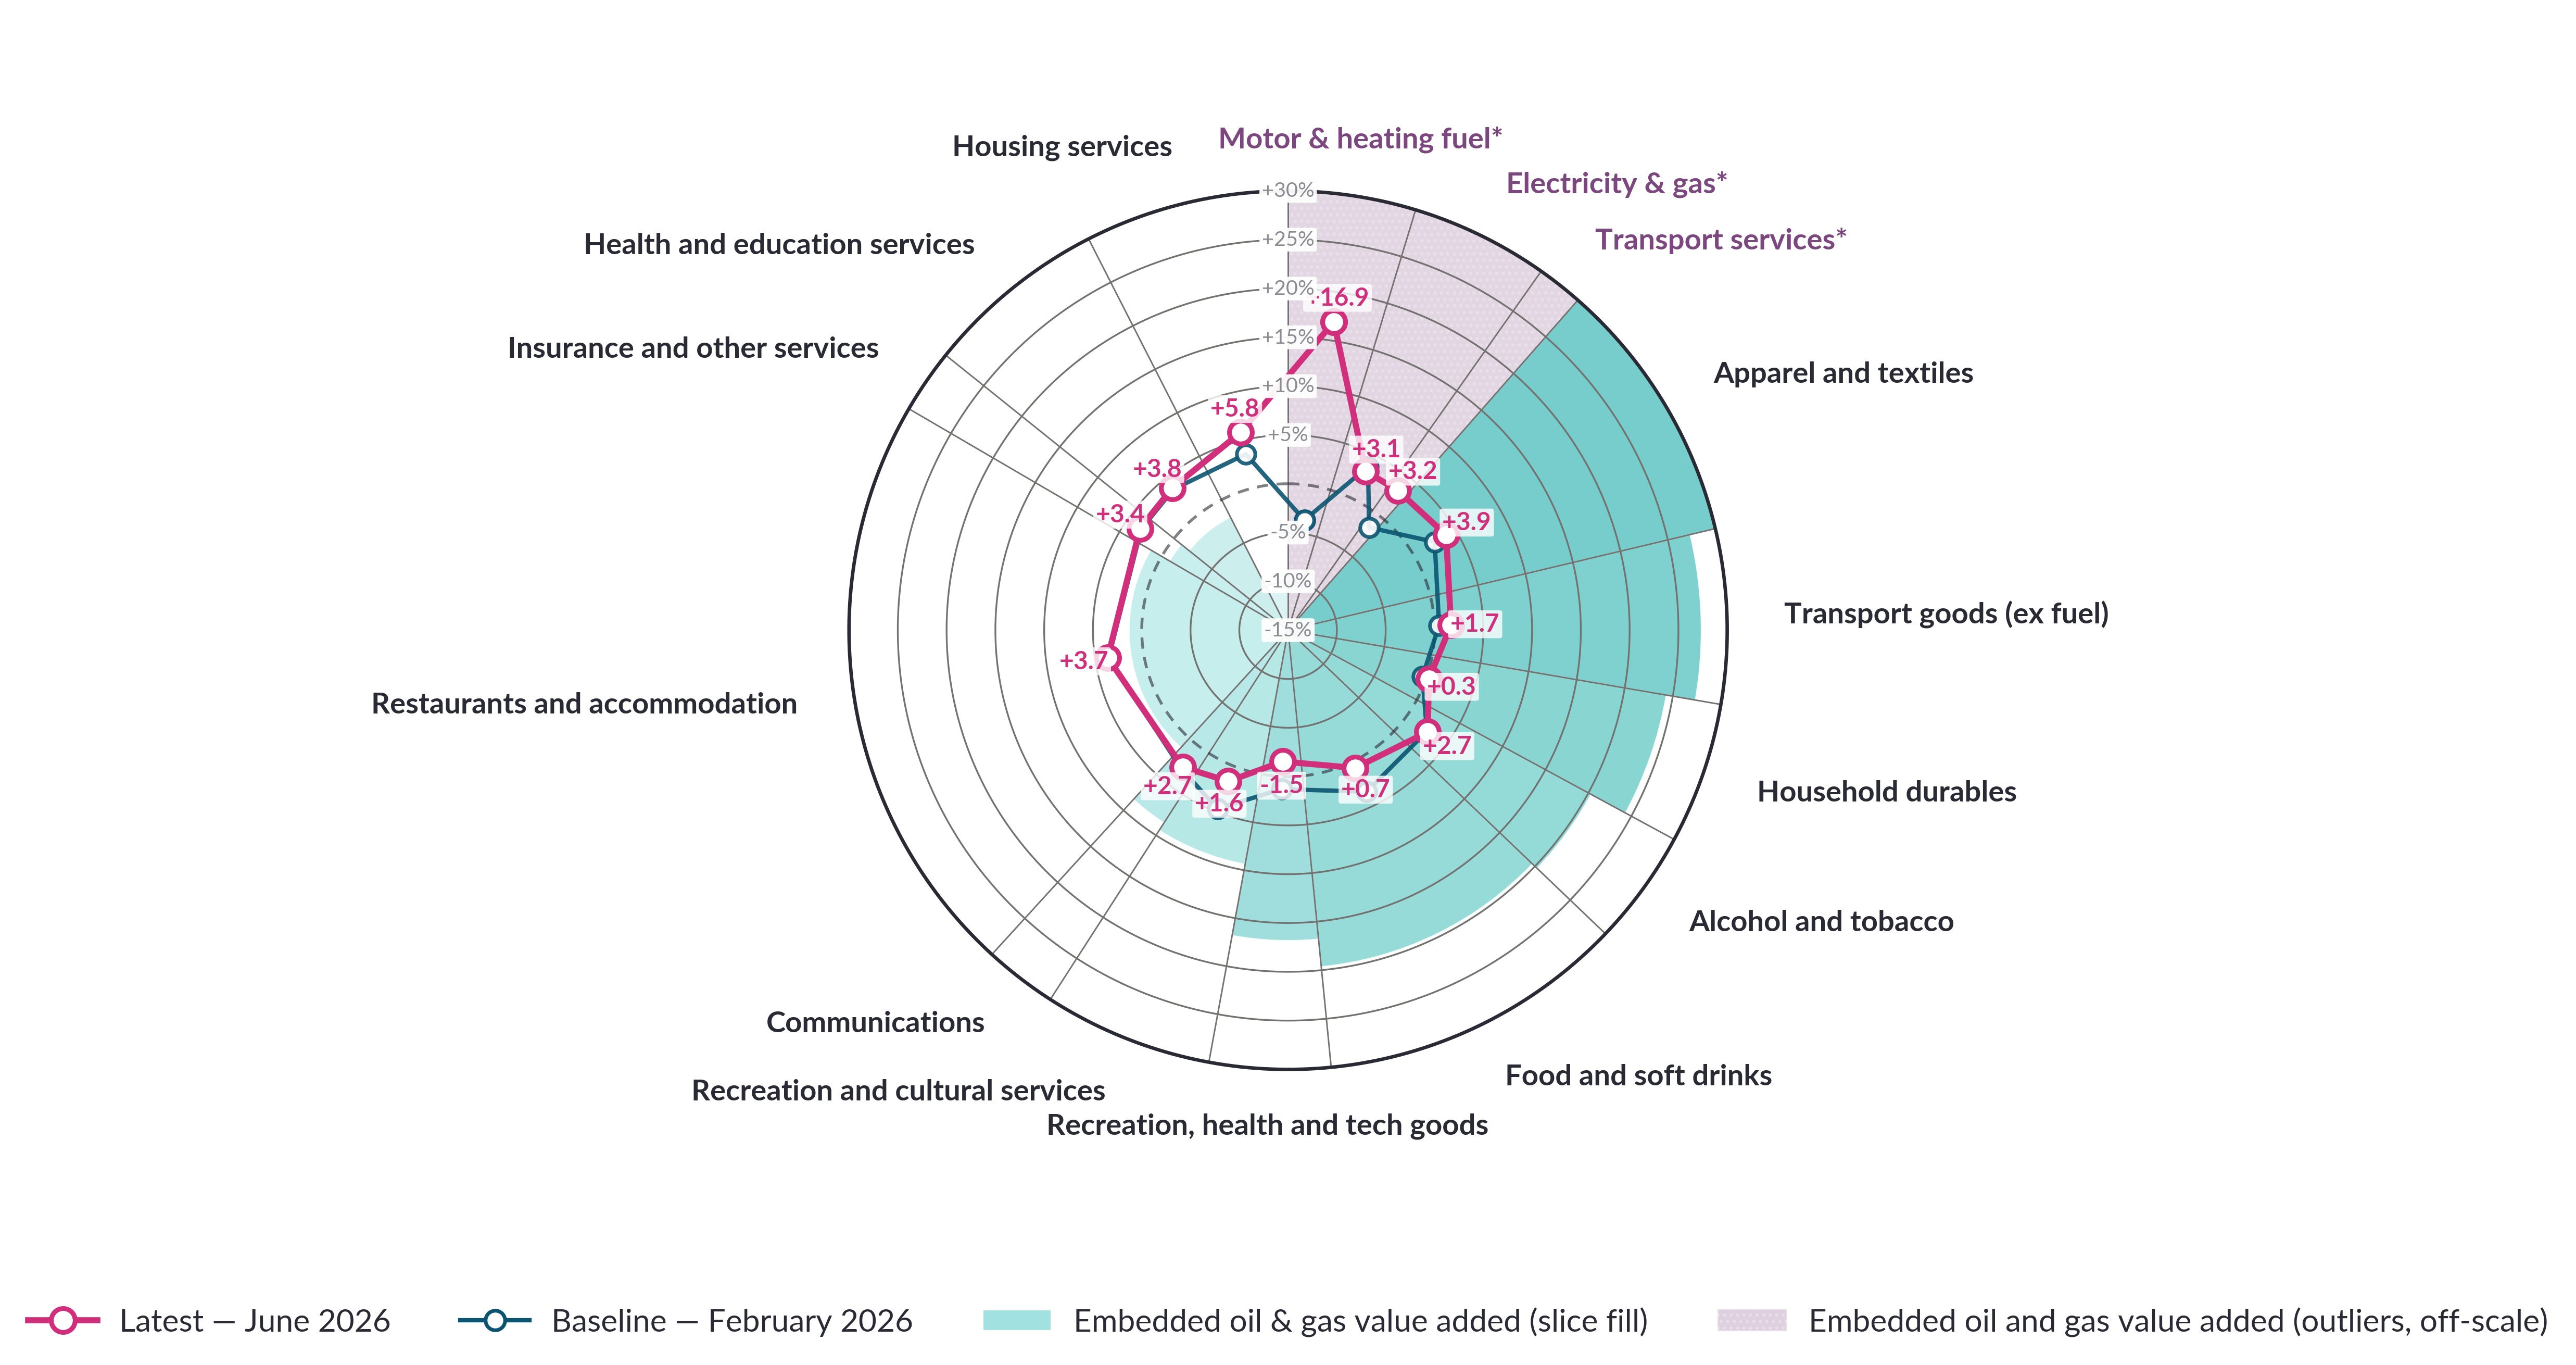
Because supply-chains are relatively stable structurally and price data arrives monthly, we can apply the framework as a real-time monitor of cost-push energy price inflation. In (Figure 7), we plot each consumer goods category on a single segment where the segment width represents its HICP weight, the shaded fill indicates its embedded oil-and-gas exposure, and the two rings trace category inflation in June 2026 against the pre-shock February 2026 baseline. The June versus February 2026 comparison highlights that the oil price shock has been dominant thus far. Motor fuel and home heating oil swung sharply outward (moderating since April following the excise cut and easing oil prices), while gas and electricity barely moved. Transport services, the most oil-exposed indirect category at around 7 cents of embedded oil-and-gas value added per euro, swung sharply in April and May, but this largely reflected a calendar effect rather than energy price pass-through as Easter fell on 20 April in 2025 but 5 April in 2026, producing offsetting base effects in air fares, and by June the category had returned to 3.2 per cent, close to its pre-shock pace. Apparel and transport goods have accelerated by around one to one and a half percentage points relative to February, implying that indirect supply-chain effects are still building, consistent with the lags embedded in production and distribution chains.
Energy Price Spillovers – Monitoring Increases in oil and gas Prices
Figure 7: Spider Chart of Energy Price Spillovers by Consumer Goods Category
Source: CSO, Eurostat and author calculations. Chart data in accessible format (XLSX 48.28KB).
Notes: Each segment is one consumer category; segment width = HICP weight, segment fill = embedded oil-and-gas value added (outliers in pink and with an asterisk, other categories in blue), and the two rings show category inflation in June 2026 (red) versus the pre-shock February 2026 baseline (blue). The inner dashed circle is the point in which annual inflation goes from positive to negative (zero value on the dashed circle). The two direct-energy categories and transport services are shown off-scale because their oil-and-gas exposure far exceeds the other categories’.
Caveats and Interpretation
The analysis performed in this note requires three caveats. First, the input-output structure is annual and lags the price data (FIGARO 2023, CSO SUT 2022), so exposures are carried forward and refreshed with a three-year lag, while prices update monthly. Second, the scenario calculation is static, assumes full cost pass-through and abstracts from behavioural and policy responses. In practice, direct fuel effects may pass through quickly while indirect supply-chain effects may emerge over several quarters. It should therefore be read alongside, not as a substitute for, the QB’s annual inflation paths. Third, the mapping of HICP-based consumer price categories to I/O-and-SUT-based basic prices is imperfect due to definitional differences, so may carry some measurement error, although we believe this to be small at an aggregated category level.
Conclusion
Combining global input-output tables with Irish supply-use data allows us to trace the full supply chain embedded in each Irish consumer goods and services category, separating imported from domestic content and energy from non-energy components on a consistent basis. Our analysis demonstrates that inflation in 2022 saw a large contribution from imported and energy-driven components, that a persistent domestic non-energy contribution has remained from 2021 through 2026, and that 2026 has brought a renewed, oil-specific and imported energy shock – visible in fuel prices and traceable through the supply chain into the cost of other goods and services categories. When applied to the adverse and severe energy-price paths underpinning the Q2 2026 QB, the direct energy-bill channel contributes roughly three times as much as the indirect supply-chain channel, but both are material. The indirect channel accounts for about 0.5 and 1.35 percentage points of the estimated eventual first-round HICP price-level increase in the adverse and severe cases, respectively. Updated at monthly frequency with inflation data releases, this framework offers an early-warning indicator of inflationary pressures feeding through the supply chain.
References
Central Bank of Ireland (June 2026), “Quarterly Bulletin Q2 2026”.
Chau, V., Conesa-Martinez, M., Kim, T. and Spray, J. (2026). “Global value chains and inflation dynamics.” Journal of International Economics, 161.
Dhingra, S. (2023). “A cost-of-living crisis: Inflation during an unprecedented terms of trade shock.” Speech given at the Resolution Foundation, Bank of England, 8 March.
Dhingra, S. and Page, J. (2023). “Accounting for imported and domestically generated inflation: Supply chains, monetary policy, and the UK’s cost of living crisis.” VoxEU, 25 May.
European Central Bank (June 2026), “Eurosystem staff macroeconomic projections for the euro area”.
Fröhling, A., O’Brien, D. and Schaefer, S. (2022). “A new indicator of domestic inflation for the euro area.” ECB Economic Bulletin, Issue 4/2022.
Schneider, M. (2025). “What contributes to consumer price inflation? A novel decomposition framework with an application to Austria.” Journal of Economic Structures, 14, Article 2.
Endnotes