Key Insights
Fiscal drag occurs when incomes rise but tax bands and reliefs increase by less, such that more income becomes subject to tax. We show that fiscal drag varies across the distribution and has the potential to more adversely impact lower income taxpayers relative to higher income taxpayers.
The mechanisms driving fiscal drag vary across the distribution too – with loss of tax credits the key driver for the bottom, while progressivity of tax brackets is most important at the top. We also find variation by income source, highlighting that income composition is a relevant factor too.
However, over 2019 to 2023, we estimate actual policy changes offset up to four fifths of the potential fiscal drag that could have occurred if no tax changes were made.
Introduction
What is fiscal drag?
“Fiscal drag” refers to the increase in tax revenue that occurs when there is inflation-induced nominal growth of the tax base while parameters – such as tax credits and tax brackets that define a progressive tax system – are not increased in line with such growth, leading to a rise in the average effective tax rate.[1] This effect is more prevalent in personal income taxes (PIT), which often display a high degree of progressivity due to progressive tax schedules or tax deductions and credits.
Two different determinants give rise to fiscal drag effects. The first of these is the inherent structural design of the tax system. This provides a measure of potential fiscal drag, as it reflects the fiscal drag that would occur, in theory, if the nominal tax base grows but tax parameters are not updated. The second determinant of fiscal drag effects is the degree of updating of nominal tax parameters over time to keep up with the nominal growth of the tax base. Combining the structural design with the updating of tax parameters legislated in successive budgets gives the actual fiscal drag that occurs in practice.
What do we do in this Insight?
We use a microsimulation approach to characterise the fiscal drag in Ireland’s PIT system and how it evolved over 2019 to 2023. Specifically, we apply the EUROMOD tool to individual level input data from the 2020 EU-Survey of Income & Living Conditions (EU-SILC, where the reference period for income is 2019) and conduct two microsimulation exercises (see the appendix for a description of the EUROMOD tool). In the first of these (our “theoretical” simulation), we estimate the potential fiscal drag effect embedded in the design of the tax system. In the second microsimulation exercise (our “practical” simulation), we incorporate the PIT updates that were implemented by the government between 2019 and 2023 to estimate the actual fiscal drag that occurred in practice over this period.
The analysis presented reflects the Irish results of a larger, cross-country project conducted by the ESCB Network on Microsimulation Modelling. This project followed on from previous analysis for Spain by Balladares & García-Miralles (2025). We define “PIT” as revenue from PAYE taxes, self-assessed income tax and the Universal Social Charge (USC) and the “tax base” as all incomes subject to PIT before any exemptions, allowances or deductions are applied. This includes income from employment, benefits & pensions, self-employment and capital (property & investment).
What do we find?
In our first (“theoretical”) simulation, we show that the potential fiscal drag effect varies by type of income. It also varies by position in the income distribution, with the effect larger for lower income taxpayers than higher income taxpayers, in relative terms. This result is partly mechanical (due to a higher prevalence of zero taxpayers in lower income deciles who are excluded from our calculations[2] but is also structural, consistent with marginal tax rates in progressive tax systems typically being larger than average tax rates. To understand how, consider an individual close to exhausting their tax credits. A small increase in income for this individual could be enough to generate a tax liability where previously there was none. Similarly, a small increase in income for an individual close to the 40 per cent tax threshold could be enough to push that individual into the higher tax bracket. In both cases, the tax responsiveness will be larger than that of a small income increase for a high income individual already paying tax at the highest possible rate. Therefore, the potential fiscal drag effect is inherently regressive and, depending on policy-maker priorities, updating tax parameters may be relevant to offset this regressivity at the margin.
In our second (“practical”) simulation, we estimate that actual policy updates offset around 80 per cent of the potential fiscal drag that could have occurred had no tax parameters been updated. This result is achieved because the government’s updates to tax parameters (particularly to tax credits which we show are an important mechanism driving fiscal drag at the bottom of the distribution) enables the Irish tax system to remain highly progressive and limits large increases in tax liability for lower income taxpayers. We illustrate this in our finding that average effective tax rates are significantly larger in the higher income deciles than those at lower income deciles. This means a much larger proportion of PIT revenue is generated from those on incomes at the upper end of the distribution. These two characteristics highlight the narrowness in the PIT base in Ireland, which is a key risk to the Exchequer.
Fiscal Drag in Theory
Measuring potential fiscal drag
To characterise the progressivity embedded in Ireland’s PIT system – and thereby measure the potential fiscal drag effect – we estimate the Tax-to-Base (TTB) elasticity, as at 2019. We define the TTB elasticity as the relative change in tax revenue following a nominal homogeneous 1 per cent increase in the tax base with no change in tax legislation. We do this by simulating a 1 per cent increase in the gross income of each individual taxpayer in the sample and calculate their new PIT liability. Then, summing across taxpayers, we measure the overall fiscal drag effect as the relative change in total PIT revenue divided by the relative change in the total taxable base. This elasticity measure is equivalent to the average marginal tax rate divided by the average tax rate.
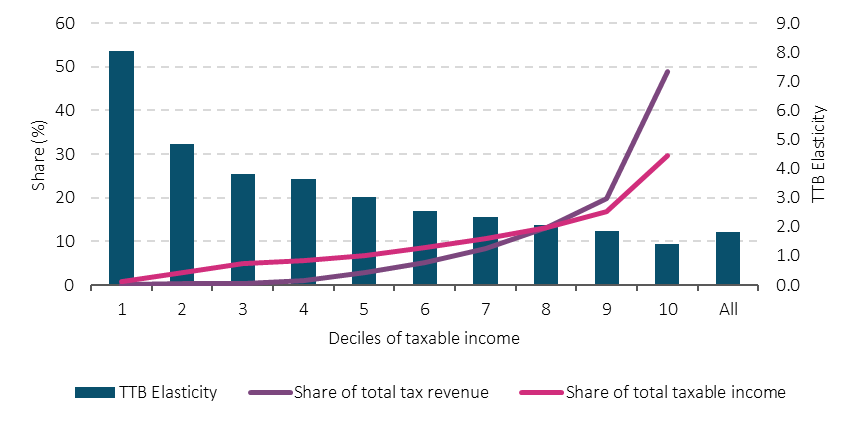
We find an aggregate TTB elasticity of 1.81 per cent, implying a 1 per cent increase in the taxable income base produces a 1.81 per cent increase in PIT revenue (Figure 1). Across Europe, most countries have tax systems producing TTB elasticities in the range of 1.7 to 2.0 (García-Miralles et al., 2025 forthcoming), so our estimate places Ireland around the middle of that range. It is also similar to previous estimates for Ireland. For example, Price, Dang & Botev (2015) find 2.04 (drawing on a data sample covering 1990-2013) and Acheson et al. (2017) obtain estimates of 2.0 for income tax and 1.2 for USC (based on the 2003–2013 tax structure). More recently, Conroy (2020) estimates an elasticity of 1.4 for income tax (inclusive of USC and the pre-2011 income levy) – using a dataset covering 1987-2017 adjusted for tax policy changes.
The key advantage of our microsimulation approach is its bottom up approach to generating elasticities, including across the income distribution. Existing work using empirical methods such as time series regressions, are absent of distributional analysis (e.g. van den Noord, 2000, Wolswijk 2007) whilst those applying analytical expressions to Revenue data are limited by this being available only in the form of income ranges that do not reflect a balanced breakdown of the distribution (e.g. Acheson et al., 2017). Rather, after calculating their elasticities we rank individuals by their taxable income and divide them in to 10 equal groups (deciles). In this way our microsimulation approach can more meaningfully and precisely explore the distributional impact.
Comparing across the distribution
Looking across the individual tax base distribution, the potential fiscal drag effect is regressive. The TTB elasticities are largest at the bottom and highest at the top. At first look, this result may seem counterintuitive given the Irish PIT system is highly progressive. This is illustrated by the steep right-hand skewness of the tax revenue distribution (Figure 1). Specifically, our simulation finds individuals in the top two deciles contribute around 70 per cent of total PIT revenue in the State, in contrast to less than 5 per cent for the bottom 50 per cent. This result is consistent with Revenue data showing the top 18 per cent of taxpayers accounted for three quarters of all income tax in 2019. However, it also highlights the narrowness in the PIT base that exists in Ireland. This is a key risk to the Exchequer and one identified in previous Central Bank analysis (Boyd et al., 2025 (PDF 0.98MB)).
While Ireland’s PIT system is highly progressive (lines), fiscal drag poses a larger potential impact to lower income taxpayers (bars)
Figure 1: Theoretical TTB Elasticity – by deciles of taxable income, IE 2019
Source: EUROMOD simulation and authors’ calculations
Note: TTB Elasticity refers to the relative change in tax revenue following a nominal homogeneous 1 per cent increase in the tax base with no change in tax legislation.
Accessibility: Get the data in accessible format (CSV 0.24KB)
The large TTB elasticities in lower deciles are in part mechanical, driven by the high share of zero taxpayers (for example, over eight in 10 taxpayers in the first decile pay zero PIT according to our simulation) who we exclude from the elasticity estimates. Therefore, changes in tax liability of those that do pay tax have a large impact on the lower decile elasticities. The regressive pattern is also consistent with tax responsiveness to small changes in income being potentially much greater for lower decile taxpayers. At the same time however, because the Irish tax system is progressive and higher deciles pay more tax, their lower TTB elasticities carry more weight in the aggregate. This is why we find an overall TTB elasticity that is closer to the TTB elasticities at the top of the distribution
Comparing across income sources
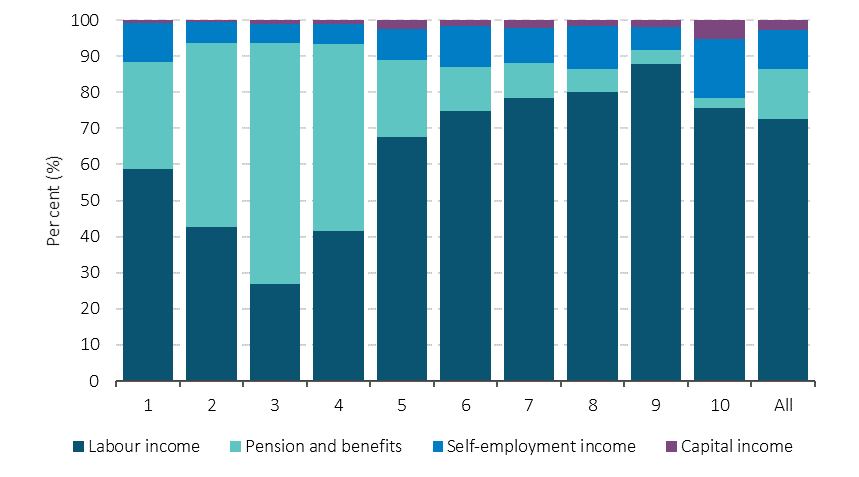
To examine how the TTB elasticity varies by income component, we apply a 1 per cent increase separately to labour, benefits & pension, self-employment and capital (property & investment) income. We find the TTB elasticity is lowest (0.71 per cent) under a 1 per cent increase in income from benefits & pensions only. The highest TTB elasticity is obtained with self-employment income (2.12 per cent) while capital and labour income recorded similar elasticities (2.03 and 1.97 per cent respectively).[3] The TTB elasticity being lowest under benefits & pension income is consistent with many welfare payments being exempt from PIT and with this income source being most important at the lower-end of the distribution (Figure 2). Similarly, finding the highest TTB elasticity for self-employment income is likely related to this source being liable for an additional USC rate and may also be driven by its distribution.
The importance of different income sources vary by taxpayer’s taxable income
Figure 2: Composition of taxable income (%) – by deciles of taxable income, IE 2019
Source: EUROMOD simulation and authors’ calculations.
Note: TTB Elasticity refers to the relative change in tax revenue following a nominal homogeneous 1 per cent increase in the tax base with no change in tax legislation.
Accessibility: Get the data in accessible format (CSV 0.3KB)
Mechanisms driving fiscal drag
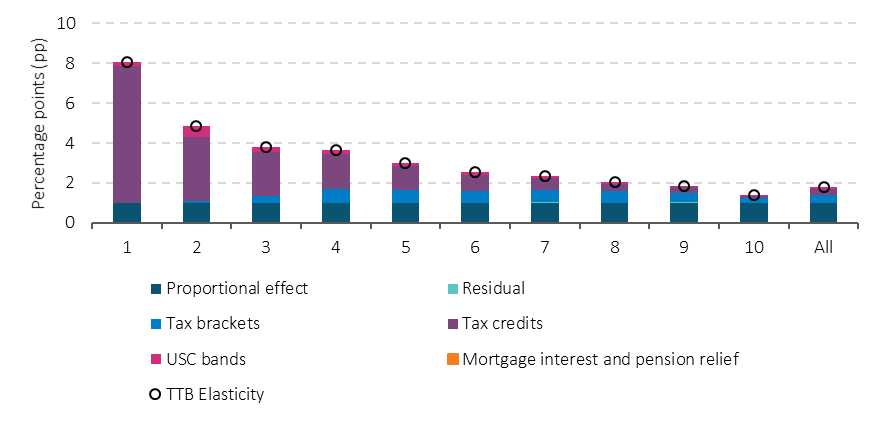
To further explore the inherent mechanisms driving fiscal drag, we conduct a series of partial indexation simulations. We increase different parts of the Irish PIT system by 1 per cent to understand which parameters – if not indexed – are most important for driving fiscal drag. We find that, in aggregate, around half of any fiscal drag which could occur in Ireland is attributable to the progressivity of tax brackets (Figure 3). A further 38 per cent is due to the relative loss in the value of tax credits. USC bands drive the remainder, with pension and mortgage interest relief having no meaningful role once other factors are accounted for.
The mechanisms driving fiscal drag vary by taxpayer’s taxable income
Figure 3: Decomposition of TTB Elasticity (percentage points) – by deciles of taxable income, IE 2019
Source: EUROMOD simulation and authors’ calculations
Note: Proportional effect reflects the mechanical 1 per cent increase in fiscal drag that purely occurs due to a 1 per cent increase in income.
Accessibility: Get the data in accessible format (CSV 0.53KB)
However, the relative importance of the mechanisms varies across the distribution. For example, losing tax credits is responsible for the vast majority of the fiscal drag effect in the first three deciles and more than half for individuals up to the sixth decile. At this point, the progressivity of tax brackets becomes the most prominent driver; accounting for 48-56 per cent of the fiscal drag effect amongst the top 4 deciles. The importance of USC bands is greatest for the top decile (17 per cent) but the contribution is also notable for the second decile (14 per cent), emphasising kinks in the tax system.
Fiscal Drag in Practice: 2019-2023
Estimating actual fiscal drag using scenario analysis
To explore how fiscal drag evolved in recent years, we conduct a second microsimulation exercise which simulates four counterfactual scenarios (see the appendix for further detail on how this is performed using EUROMOD). We consider the impact of each scenario on TTB elasticities, as well as tax revenue and tax rates. The four scenarios are presented in Table 1 and summarised as follows:
- Observed tax changes – This is our baseline scenario which estimates the fiscal drag associated with actual tax collection between 2019 and 2023, based on the tax policies implemented over those years (including new policies such as the rent tax credit in 2022 and mortgage interest relief in 2023).
- Tax system unchanged since 2019 – This scenario provides an extreme upper bound for how fiscal drag could have evolved by applying the same tax policies in 2023 as in 2019.
- Tax system indexed to observed growth in the tax base – This scenario provides a lower bound for how fiscal drag could have evolved by indexing 2019 tax policies (namely tax bands and credits) to the growth in nominal taxable income over 2019 to 2023 that we observe in our simulated Scenario 1 (+14.89 per cent), but new tax policies are excluded.
- Baseline without indexation – This scenario re-performs our baseline scenario for 2023 (as in Scenario 1), but without the discretionary indexation changes implemented over the period. This scenario helps disentangle the effects of indexation reforms from new policies that affected PIT revenue (namely the rent tax credit and mortgage interest relief).
Estimating actual fiscal drag with EUROMOD relies on comparing counterfactuals
Table 1: Counterfactual scenarios – varying indexation, legislation and nominal parameters
| (1)
Observed Tax changes (2023 Baseline) | (2)
Tax system unchanged since 2019 | (3)
Tax base indexed to observed growth in the tax base | (4)
2023 Baseline without indexation |
|---|
| PIT legislation | 2023 | 2019 | 2019 | 2023 |
| Nominal PIT parameters | 2023, indexed as observed | 2019, no indexation | 2019, fully indexed to tax base growth | 2019, no indexation |
Note: This table summarizes the alternative simulations we run for the year 2023. Column (1) shows our baseline simulation that aims to replicate observed tax collection for that year. Columns (2) to (4) show different counterfactual scenarios we consider for the year 2023 under different indexation practices and different PIT legislation. All simulations are based on the same microdata (EU-SILC 2020) updated to incomes of 2023.
Impact on elasticities
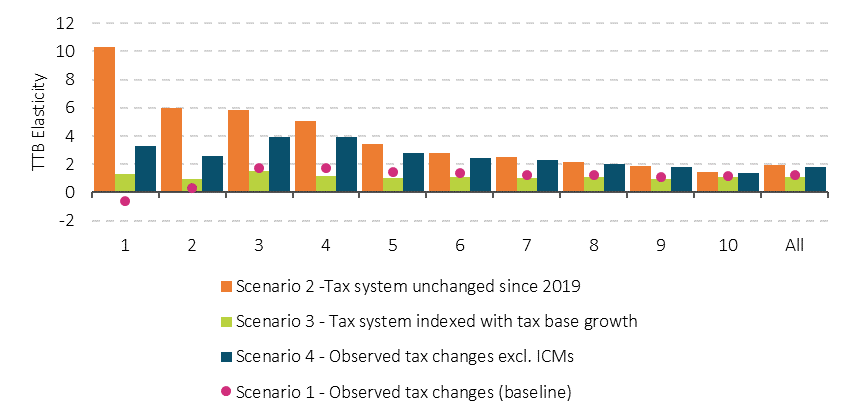
We estimate that the aggregate TTB elasticity observed in 2023 was 1.25 per cent (Scenario 1, pink bars in Figure 4). However, across the distribution, the TTB elasticity is negative in the first decile before it increases up to the third decile to reach 1.76 per cent and then declines to a low of 1.12 per cent in the ninth decile. Finding smaller TTB elasticities in practice compared to the theoretical profile, reflects the important role played by discretionary changes to tax credits in mitigating fiscal drag at the bottom of the distribution. This is consistent with our earlier analysis showing tax credits to be an important mechanism for driving the extent of fiscal drag in lower decile groups.
Fiscal drag over 2019-2023 was less regressive than had the tax system been unchanged
Figure 4: TTB Elasticity – under different scenarios by deciles of taxable income, IE 2023
Source: EUROMOD simulation and authors’ calculations.
Accessibility: Get the data in accessible format. (CSV 0.4KB)
Had there been no change in tax policies from 2019 (Scenario 2, orange bars in Figure 4), then an aggregate TTB elasticity of 1.94 per cent is obtained. This elasticity is almost 0.7 percentage points higher than our baseline and displays a regressive pattern similar to our theoretical profile. The TTB elasticity in the first decile group is positive and high (10.32 per cent) while the top decile records the lowest TTB elasticity (1.43 per cent).
Indexation (Scenario 3, green bars in Figure 4) produces the lowest aggregate TTB elasticity (1.10 per cent), consistent with this scenario intended to fully mitigate fiscal drag.[4] Across the distribution, the largest TTB elasticity is recorded in the third decile group. This matches the location of the peak TTB elasticity in the baseline. The largest differences in elasticities compared to the baseline are observed in the lower deciles. One explanation could be differences in tax credits between scenarios. For example, Scenario 1 includes the new rent tax credit while Scenario 3 does not. This would be consistent with tax credits acting as a channel for strong revenue responsiveness (Acheson et al. (2017) and our earlier theoretical exercise showing tax credits to be the key driver of fiscal drag for these groups.
Impact on tax revenue
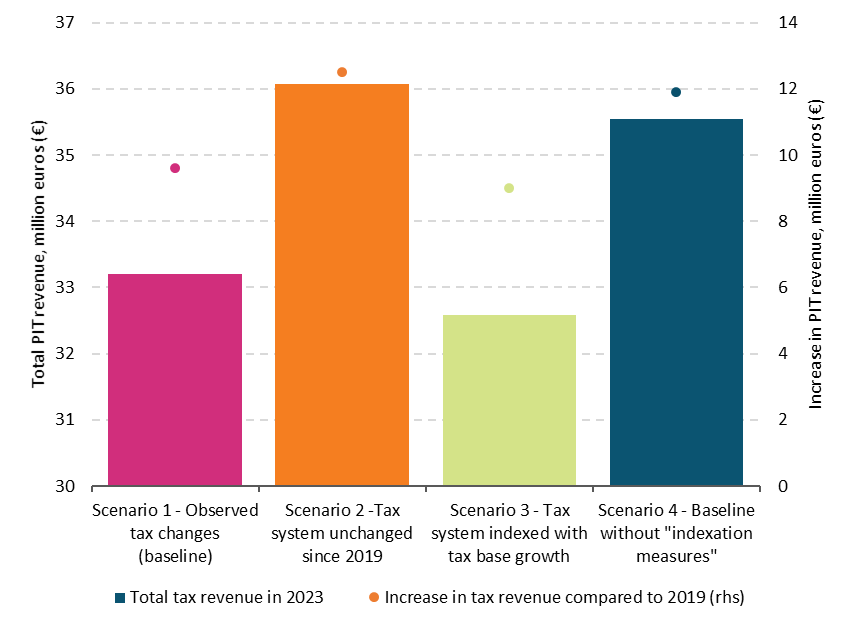
Another way to compare our simulated scenarios is to consider how much PIT revenue is raised under each scenario. Our baseline results show PIT revenue grew 40.7 per cent or €9.6bn between 2019 and 2023 (Scenario 1 in Figure 5). Over half of this change in tax revenue (€4.8bn) was paid by the top decile group alone. Had the tax parameters not been updated from 2019 levels (Scenario 2 in Figure 5), the increase in PIT revenue would have been an additional €2.9bn higher, at around €12.5bn instead. We can therefore think of this amount as being the value of “offset fiscal drag”.
Fiscal drag would have increased PIT revenue in 2023 by an additional 30 per cent, if tax parameters were unchanged from 2019
Figure 5: Total and increase in PIT revenue (€, millions) – under different scenarios, IE 2019-2023
Source: EUROMOD simulation and authors’ calculations.
Accessibility: Get the data in accessible format. (CSV 0.49KB)
In contrast, had the tax system been fully indexed to growth in the tax base (Scenario 3 in Figure 5) then the increase in revenue would be €0.6bn lower than the baseline, at around €9.0bn. Given Scenario 3 is akin to full indexation, we can think of the difference between Scenarios 3 and 1 (€0.6bn) as the “actual fiscal drag” that occurred between 2019 and 2023 in our microsimulation. Similarly, given the government could have elected to keep the 2019 system unchanged, we can think of the difference between Scenarios 2 and 3 (€3.5bn) as the “potential fiscal drag”. Comparing these differences, we conclude that the legislative changes implemented by government between 2019 and 2023 offset around 80 per cent of potential fiscal drag, with respect to indexation to growth in the tax base. Decomposing this, we find almost three quarters of this offsetting accrued to the top four deciles, in line with these groups paying the vast majority of PIT. Interestingly, observed tax collection is smaller in the bottom two deciles than under the full indexation counterfactual. This suggests that new policies (rent tax credit and mortgage interest relief) when paired with discretionary indexation (changes in existing tax brackets and credits) potentially decreased tax collection for some taxpayers in these deciles in a way akin to an over-indexation effect.
To explore this further and understand how important discretionary indexation changes were compared to new policies introduced over 2019-2023, we re-run our baseline but without the discretionary indexation changes. The results show that PIT would have measured around €35.5bn, some €2.3bn higher than our baseline (Scenario 4 in Figure 5). This implies that close to 70 per cent of the offsetting was due to discretionary indexation changes, with this playing a more important role for the top of the distribution. In light of the possible overestimation of the impact of the new rent tax credit and mortgage interest relief, 70 per cent likely represents a lower bound of the true importance of discretionary changes to existing tax brackets and tax credits in alleviating fiscal drag.
Impact on tax rates
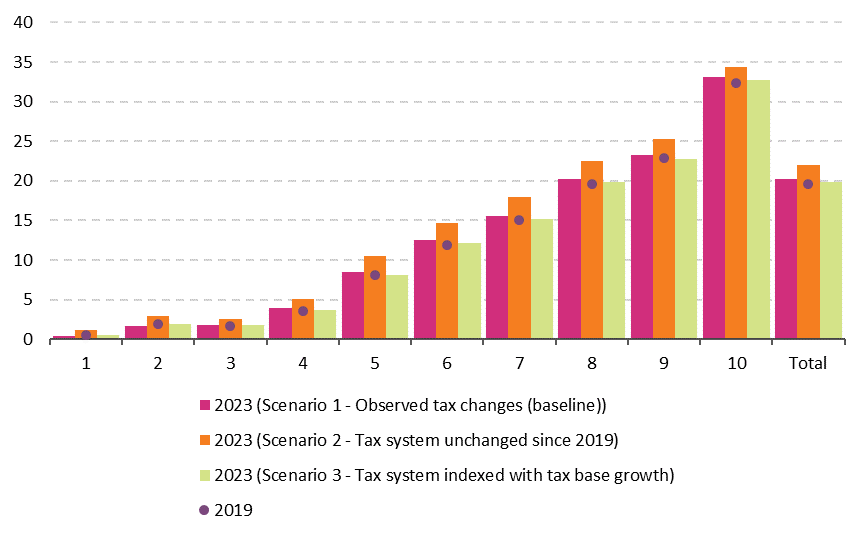
Finally, we can also compare our scenarios through the lens of average effective tax rates (AETR) reflecting the ratio between PIT revenue and taxable income. We estimate the AETR to be 19.6 per cent in 2019, rising to 20.2 per cent in 2023 in our baseline (Scenario 1, Figure 6). However, had the tax system remained unchanged, the AETR would be 22 per cent (Scenario 2, Figure 6). In contrast, indexing to tax base growth would produce a largely unchanged AETR of 19.8 per cent (Scenario 3 in Figure 6).
The average effective tax rate would be two percentage points higher in 2023, if the tax system had remained as it was in 2019
Figure 6: Average effective tax rates (%) – under different scenarios, IE 2019-2023
Source: EUROMOD simulation and authors’ calculations.
Accessibiity: Get the data in accessible format. (CSV 0.72KB)
Finding the AETR for the full indexation counterfactual almost coincides with the AETR observed in 2019 is reassuring and consistent with the idea that keeping the legislation constant over time, and updating parameters according to the same rate as the growth of the nominal tax base, achieves close to full offsetting of fiscal drag and keeps the effective tax rate constant. This is true across the distribution. Between 2019 and 2023, the AETR rose slightly for all decile groups, except the bottom two where it declined slightly (Scenario 1 in Figure 7). Had the tax system remained unchanged, the AETR would have rose across the distribution, with the strongest gains observed in the fifth to ninth decile groups (Scenario 2 in Figure 7). More generally, the AETRs are clearly shown to be larger in the upper decile groups. This is consistent with our earlier analysis finding the PIT base in Ireland is narrow and that benefits and pensions (which are more often tax exempt) make up a larger share of the incomes of lower decile groups.
Conclusion
The recent spike in inflation and the consequent growth in household income has triggered a renewed interest in fiscal drag. In this Insight, we use a microsimulation approach to characterise the fiscal drag in Ireland’s PIT system. We show that when nominal incomes grow and tax parameters are not fully updated, tax revenue and average effective tax rates rise in response. For Ireland, this fiscal drag effect is inherently regressive. This is partly mechanical (due to the higher share of zero taxpayers in lower deciles) and partly structural (due to the design of the tax system meaning the responsiveness of tax revenue to marginal changes in income is larger for lower decile taxpayers).
Over 2019 to 2023, our simulation indicates fiscal drag amounting to around €0.6bn occurred. However, a further €2.9bn could have occurred had the government left tax parameters unchanged at 2019 levels. Therefore, while Ireland does not operate an automatic indexation regime, discretionary changes made by government over this period were akin to an indexation effect. The findings and derived elasticities are relevant for the European fiscal governance framework as fiscal drag is relevant for calculating the discretionary fiscal measures under the framework. The analysis could also be used for considering forecasting improvements (Conroy, 2023) by taking into account the responsiveness of different households to tax changes across the income distribution and across different income sources.
The results also have implications for tax design. Our simulation shows fully indexing tax parameters to nominal income growth between 2019 and 2023 could have cost up to €3.5bn. Given the Department of Finance’s Tax Strategy Group (2024) estimated the cost to the government of fully indexing the PIT package in Budget 2024 was €1.2bn, it is clear that indexation can be costly. However, our simulation shows that fiscal drag has a heterogeneous impact, with effects larger for low income taxpayers. Budgetary planning must carefully consider these differential impacts and the trade-offs between indexation and expenditure decisions elsewhere. Ultimately, the decision to update tax parameters and by how much represents a complex discretionary choice for government. However, as this Insight shows, the narrowness of the PIT base is a key vulnerability for the Exchequer. Higher income taxpayers pay a large majority of the PIT and any reduction in the number of these taxpayers poses a significant downside risk to revenues.
References
Acheson, J., Deli, Y., Lambert, D., & Morgenroth, E. L., (2017). Income tax revenue elasticities in Ireland: an analytical approach. The Economic and Social Research Institute Research Series: Dublin, (59).
Balladares, S, and García-Miralles E., (2025). Fiscal drag with microsimulation: Evidence from Spanish tax records. IEB Working Paper 2025/08.
Boyd, L, Conefrey, T, Hickey, R, Lozej, M, Madzharova, B, McInerney, N, & Walsh, G., (2025). Managing Risks and Building Resilience in the Public Finances. Quarterly Bulletin Articles, Central Bank of Ireland, pages 2-34, June.
Conroy, N., (2020). Estimating Ireland’s tax elasticities: a policy-adjusted approach. The Economic and Social Review, 51(2, Summer), 241-274.
Conroy, N., (2023). The role of elasticities in forecasting Irish income tax revenue. The Economic and Social Review, 54(2, Summer), 149-172.
Department of Finance (2024). Income Tax Strategy Group – 24/01, July 2024. Available at: https://assets.gov.ie/static/documents/tsg-24-01-income-tax.pdf
García-Miralles E., et al., (2025 forthcoming). Fiscal drag in theory and in practice: a European perspective. ECB Working Paper.
Price, R., Dang, T. T., & Botev, J., (2015). Adjusting fiscal balances for the business cycle: New tax and expenditure elasticity estimates for OECD countries.
van den Noord, P., (2000), The size and role of automatic fiscal stabilisers in the 1990s and beyond, OECD Working Paper No. 230, OECD, Paris.
Wolswijk, G,. (2007). Short and long-run tax elasticities: The case of the Netherlands, ECB Working Paper No. 763, European Central Bank, Frankfurt.
Appendix: The EUROMOD Model
EUROMOD is a static, non-behavioural microsimulation model developed for the EU-27 and managed by the European Commission’s Joint Research Centre. The model works by applying a set of rules to input data in order to simulate taxes and benefits and ultimately calculate disposable income. For Ireland, these rules are provided by the ESRI.[5] However, any user can subsequently change, remove or add rules. This means EUROMOD can estimate, for each individual, the amount of tax payable under different counterfactual scenarios. EUROMOD also allows users to explore simulated results by different population breakdowns. This includes by deciles of the taxable income distribution, which this Insight uses.
In our analysis, we use input data from the 2020 EU-SILC where the reference period for income is 2019. However, this means that in our second microsimulation exercise (which explores changes over 2019 to 2023), we must first grow forward the income data to 2023 before the tax and benefit rules in our scenarios are simulated. This ensures that the simulation accounts for income growth over 2019 to 2023. We perform this “uprating” procedure using a set of nominal adjustments provided by EUROMOD. These nominal adjustments include changes in benefit rates and sector specific hourly wages. The latter are computed from Eurostat tables on wages and hours worked up to 2019, and then from 2020 are computed by multiplying the value of the previous year by the yearly increase of nominal compensation per employee sourced from the AMECO database.
A limitation of our approach is that the composition of taxpayers in 2023 will still reflect the composition of our 2020 EU-SILC sample. Therefore, we cannot account for any growth in the tax base that occurred due to an increase in taxpayers, nor do we allow for income growth varying between taxpayers. Finally, it is important to note that EUROMOD assumes full take-up of social welfare payments and tax benefits. This is relevant as our time period includes the introduction of a new rent tax credit and the return of mortgage interest relief. EUROMOD assumes that all eligible taxpayers benefit from these measures. However in reality, take-up can be lower as it depends on taxpayers applying for these via the self-assessment process, for which they have up to four years to do so. Therefore, the role of these additional credits is likely over-estimated in our simulation. To alleviate this and ensure better comparability, we re-scale our results to match official statistics. There are other reasons why a microsimulation approach may not be consistent with official statistics. For a detailed explanation, see García-Miralles et al., (2025 forthcoming).
Endnotes
- Irish Economic Analysis division. [email protected]. Thanks to Esteban Garcia-Miralles, Martin O'Brien, Thomas Conefrey, Niamh Hallissey and the anonymous referee. All views expressed in this Insight are those of the authors alone and do not represent the views of Central Bank of Ireland ↑
- This approach is consistent with Balladares & García-Miralles (2025) who provide a more detailed explanation of the rationale for choosing this approach. ↑
- This compares against previous estimates of 2.11 for labour income, 1.61 for self-employment income and 1.81 for capital income. Benefits and pension income were not estimated (Price, Dang & Motev, 2015). ↑
- In further analysis using counterfactuals applying full indexation under concurrent HICP and lagged HICP, we find ERTBs of 1.06 per cent and 1.31 per cent respectively. These additional counterfactuals are not included here for brevity, but the results are available in García-Miralles et al., (2025 forthcoming). ↑
- We are grateful to the ESRI, in particular Agathe Simon, for technical assistance. ↑