Key Insights
Ireland’s high-value export sectors are deeply embedded in global value chains, relying heavily on intermediates sourced from abroad to produce export content, leaving them highly exposed to tariffs.
Using a multi-country, multi-sector model of the world economy with input-output linkages, these sectors are identified as the main drivers of the Irish economic response to import tariffs imposed under the recent US-EU trade deal.
The moderate aggregate impact — a 0.6 per cent decline in real GDP — masks significant variation across sectors. Pharmaceuticals, most directly reliant on US demand, drives the decline in Irish output.
Highlighting the concentration of economic activity in the pharmaceutical sector, we also show that a tariff regime targeting this sector specifically with additional US tariffs could more than double the overall output losses relative to the trade deal scenario.
Introduction
Ireland’s Exposure to Trade Fragmentation
Over the past three decades, Ireland’s transformation into one of the world’s most open and export- oriented economies has been driven by its deep integration into global value chains (GVCs).[1] The process of globalisation has profoundly reshaped the Irish industrial landscape, enabling rapid growth through foreign direct investment (FDI), multinational activity, and the systematic off- shoring and onshoring of intermediate production stages. Ireland’s export-led growth model has underpinned its headline economic growth: since 1995, real Irish GDP has grown by an average annual rate of 4.4 per cent, while both exports (10.6 per cent) and imports (9.6 per cent) have experienced growth at more than twice the rate of aggregate economic activity. These figures reflect both the complexity and intensity of cross-border trade linkages used by Irish firms in the global production process.
This high degree of openness also creates structural vulnerabilities. Trade flows are increasingly shaped not only by comparative advantage but also by geopolitical tensions, industrial policy, and security considerations. In this context of rising geo-economic fragmentation — exemplified by the renewed use of tariffs as a policy tool — it is essential to understand how exposed Ireland is to disruptions in international trade, and what the macroeconomic and sectoral consequences of such shocks might be.
This Insight provides a two-part analysis of Ireland’s vulnerability to trade fragmentation.
Global Value Chain Dependence
The first part presents a detailed empirical account of Irish trade flows and GVC participation, using OECD Inter-Country Input-Output (ICIO) data. We document the structure of Irish imports and exports by sector, quantify forward and backward linkages in global value chains, and decompose value-added trade across key partners. The analysis highlights Ireland’s dependence on foreign intermediates — particularly from the rest of the EU and the US — as well as the concentration of GVC exposure across a small number of sectors.
Tariff Scenario Modelling
In the second part, we employ a multi-country, multi-sector general-equilibrium model following Baqaee and Farhi (2024) to study the effects of a changing trade policy between the US and the European Union on the Irish economy. The model features a rich production-network structure that can account for the exposures documented in the first part of our analysis. However, it is static and assumes that both capital and labour are immobile across countries but mobile across sectors within each country. Using this model, we evaluate the effects of the recent US-EU trade deal on the Irish economy. We also consider other trade policy scenarios including broad-based US–EU tariffs, symmetric retaliation, and additional sector-specific surcharges on pharmaceuticals, as alternatives.
The model predicts mild but consistently negative effects on real GDP and household welfare in Ireland for the combination of tariff scenarios that are most commonly alluded to by policy-makers.[2] While aggregate effects are modest, we find strong sectoral heterogeneity: high-value sectors such as pharmaceuticals suffer disproportionately due to their deep integration into global production networks and reliance on foreign intermediate inputs. In contrast, other high-value sectors—such as ICT and Financial Services—experience modest gains, partially offsetting the broader losses.
Overall, the results underscore the macroeconomic risks posed by global trade fragmentation for small, open economies, such as Ireland, with concentrated export structures and deep GVC integration. Our work complements a range of other scenario analysis from other Irish and European organisations, shedding new and novel light on the way in which US tariffs are likely to affect different sectors across the economy.
Irish Trade Flows and Global Value Chains
Irish Export Participation in GVCs
Global value chains (GVCs) represent the channels through which products are sold across international borders as intermediate inputs, rather than final goods, with at least two stages taking place in different countries (Gereffi and Fernandez-Stark, 2011). GVCs are integral to how firms produce and trade, and have become indispensable to modern production economies such as Ireland’s. Since 2020, almost two-thirds of Irish imports consists of intermediate goods and services used by firms as inputs in the production of final goods and services sold to consumers.
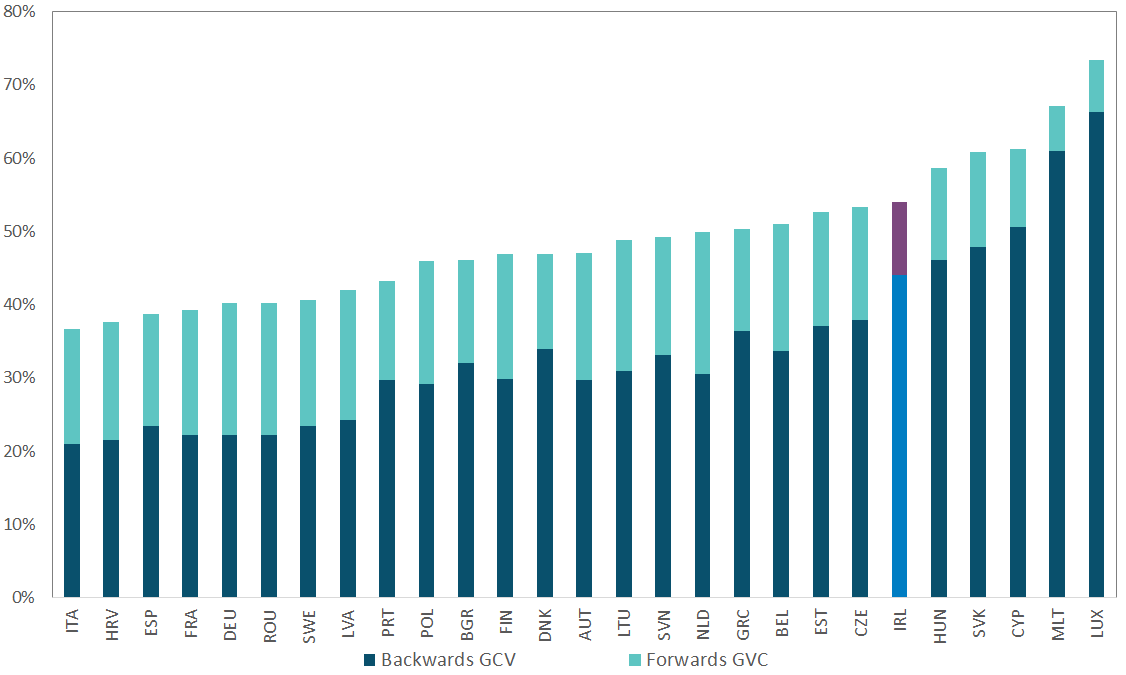
Figure 1 presents the share of value chain usage in total exports, across the set of EU-27 countries for 2020. Shares are broken down into backward and forward GVC linkages.[3] Ireland had the sixth-largest share of GVC content in exports (54 per cent), but was the only country other than Germany with more than $250 billion in total GCV-derived export content. Additionally, Ireland is far more connected to GVCs through backward linkages (44 per cent of total exports) than through forward linkages (10 per cent), suggesting a higher level of downstream involvement in GVCs.
Irish exporter participation in global value chain activities exceeds the majority of EU-27 countries
Figure 1: GVC Linkages as a share of Total Exports (2020)
 (CSV 0.65KB)
Source: Authors’ calculations using OECD ICIO data and the approach of Borin and Mancini (2023).
Accessibility: Get the data in accessible format. (CSV 0.65KB)
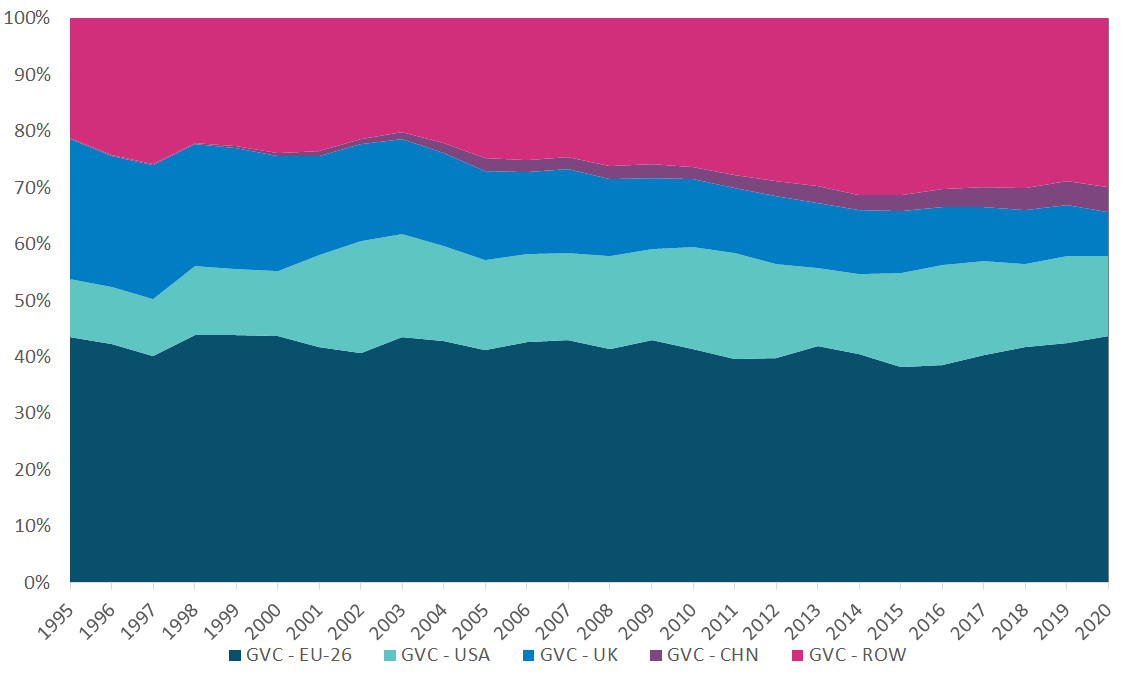
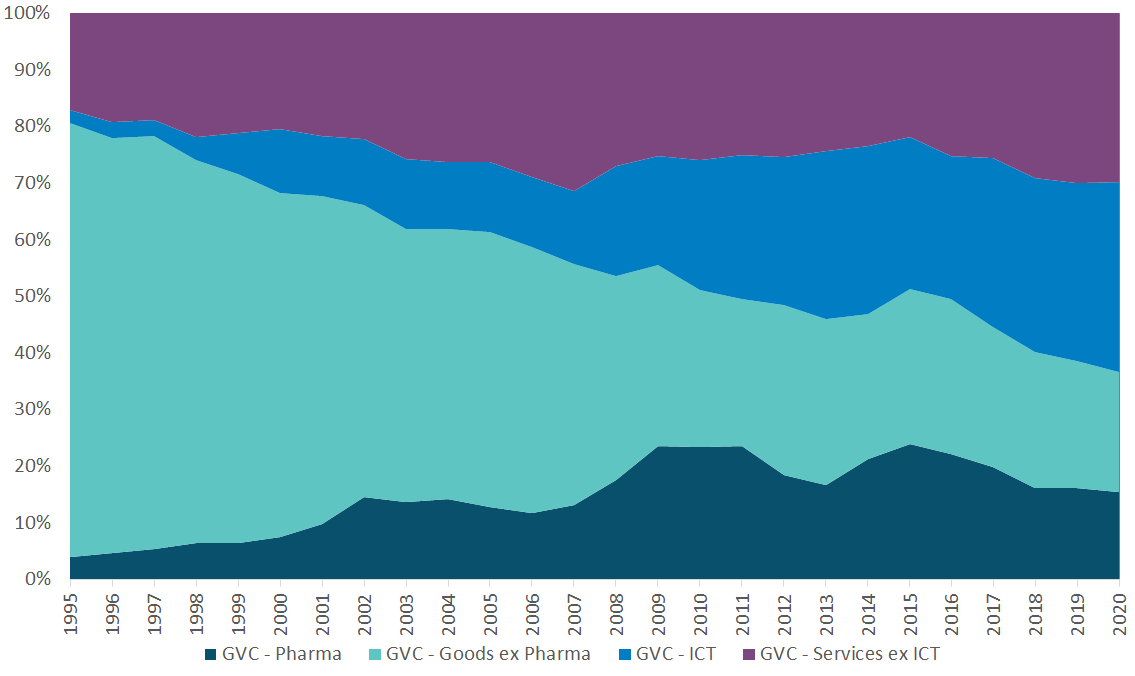
We can decompose some trade flows that take place through value chains across both geographic and sectoral dimensions. Figure 2 presents these decompositions, with the dynamics of partner- country backwards linkages shown in Panel (A) and the composition of product and services flow presented in Panel (B). At the country level, there has been a marked decline in the dependence of Irish exporters on intermediate goods and services from the UK, while a greater share (30 per cent) of backwards GVC flows now come from the rest of the world (RoW). US and EU-26 shares have remained broadly stable since the mid-2000s. Far greater movements can be seen in the sectoral flows decomposition: non-pharma goods have declined from over three-quarters of backward flows to 21 per cent in 2020, while pharmaceutical goods have risen to a 15 per cent share of 2020’s backwards GVC flows. Services trade now dominates backwards GVCs, with ICT services (33 per cent) and non-ICT services (30 per cent) combining to account for nearly two-thirds of backwards linkages in 2020.
Backward GVC linkages are diversified across countries, but concentrated across sectors
Figure 2: Geographic and Sectoral Decomposition of Irish Backwards GVC linkages (2019)
Panel A: Backwards GVC Linkages by Country
Panel B: Backwards GVC Linkages by Industry.
Source: Authors’ calculations using OECD ICIO data.
Accessibility: Get the data in accessible format. (CSV 1.41KB)
Global Value Chain Decompositions
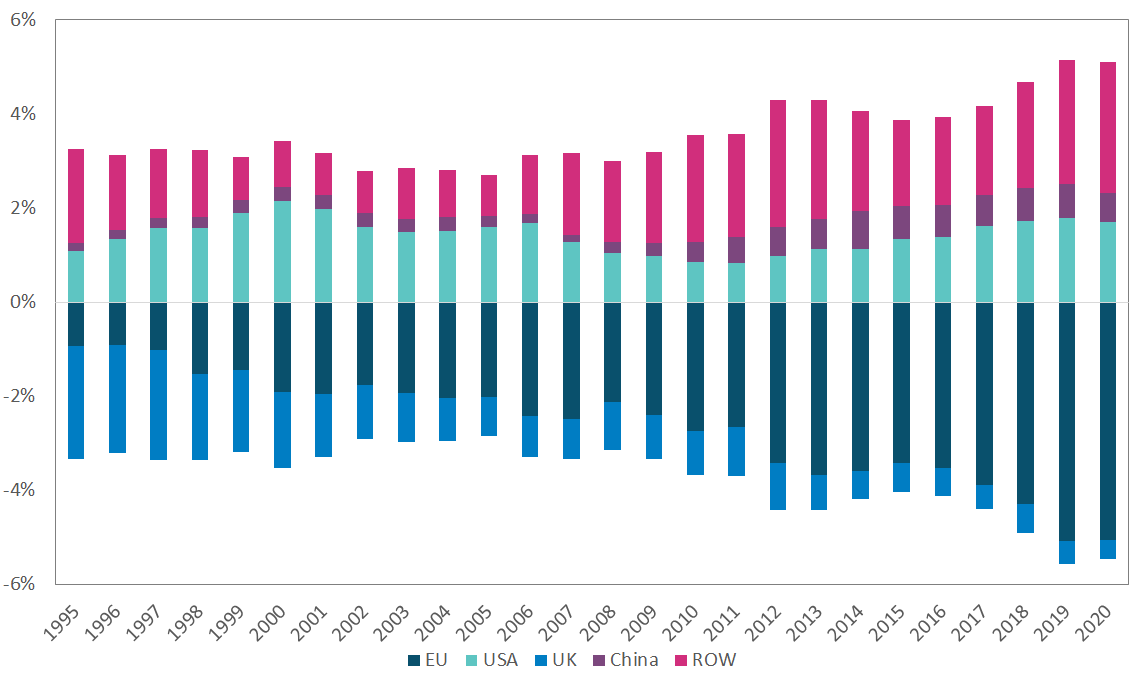
A direct consequence of global value chains is that exports can cross multiple geographic borders, resulting in the obfuscation of the final destination of goods and services exports from a country. Thus, direct trade linkages alone often provide incomplete information regarding the value added incorporated in exports induced by country-specific final demand.[4] To better understand these differences in shaping trade flows, we can examine the geographic origin of both direct exports from Ireland, and the final absorption of Irish goods by foreign consumers. Figure 3 presents the difference between absorption and direct exports by geographic origin: a positive value indicates that a specific country imports more Irish value added from third-party countries than they export to third-party countries (i.e. there is stronger consumer demand for goods and services produced in Ireland than directly imported, so Irish value-added is present in their net imports from third-party countries), while a negative value indicates that the specific country exports more Irish goods and services to other countries than are indirectly imported (i.e. Irish value added is an element of that country’s backward value chains, producing final demand exports for third-party countries).
From Figure 3, the EU and the UK consume a lower amount of Irish goods than they import: Irish goods and services are used as intermediates in their exports to third-party countries. In contrast, the US, China and the RoW consume more Irish goods than they import, obtaining the difference via third-party countries who use Irish goods and services as part of their global value chains.
To gain a clearer understanding of the industries that drive Irish export growth, and are thus most exposed to fragmentation shocks, we can alternatively decompose gross Irish exports into flows across key sectors. Examining the OECD ICIO tables over the 1995-2020 period, the data shows a strong rise in the concentration of ICT services and pharmaceuticals production in the export sector over time: Pharmaceuticals accounted for 37% of total Irish goods exports in 2020, while ICT services accounted for 47% of total Irish services exports. Combined, both pharmaceuticals and ICT services have risen from 9.6% of gross exports in 1995 to 42.3% in 2020.[5]
There can be considerable differences in the initial export destination and the final absorption country across aggregate Irish exports
Figure 3: Differential between Absorption and Direct Import of Irish Exports by Country
Source: Authors’ calculations using OECD ICIO data and the approach of Borin and Mancini (2023).
Notes: Values represent presents the percentage point difference between the share of total direct exports from Ireland imported by a given region, and the share of value added from Irish exports absorbed as final demand by that same region. Positive (negative) values indicate a net import (export) of Irish value-added via third-party countries.
Accessibility: Get the data in accessible format. (CSV 0.84KB)
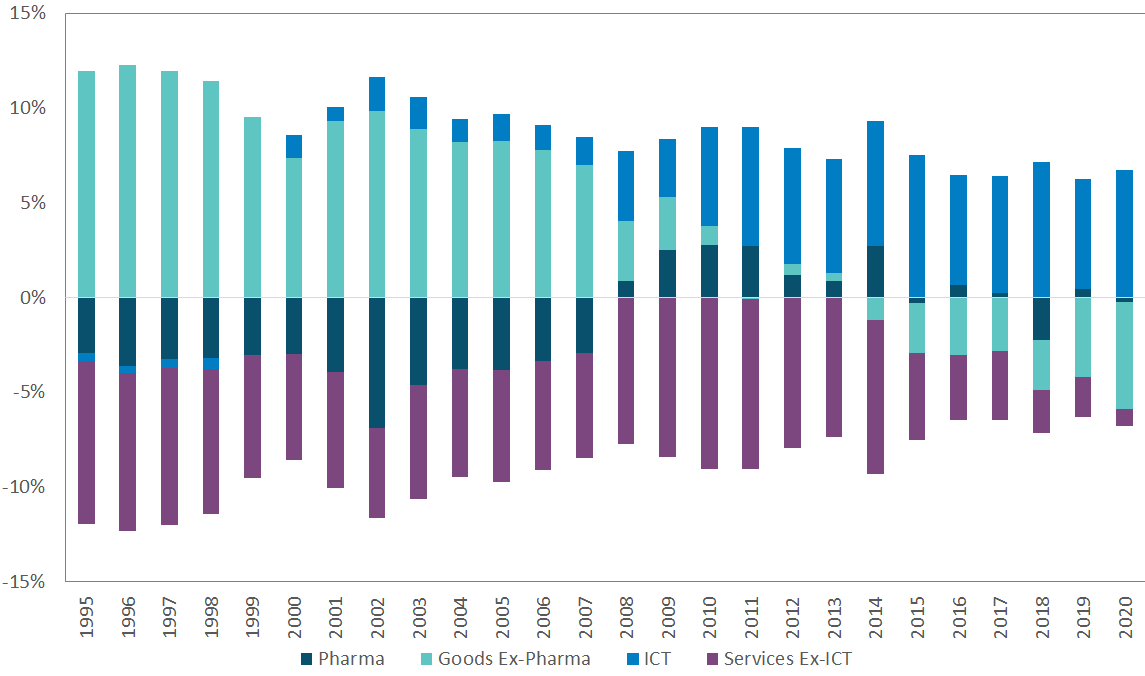
To further identify the extent to which value chain linkages exist (and differ) across sectors, we can compare exports across sectors by their share of GVC-related flows. Figure 4 presents the difference between each sector’s share of GVC-related value added in exports, and their share of value added in total exports. As seen from the chart, the ICT services sector relies heavily on GVCs: initial GVC involvement in 1995 was below the relative export share (-0.4%) in 1995, but rose persistently over time, with relative GVC-related usage exceeding relative export shares by 6.7 per cent in 2020. Similarly, the export of non-ICT services and non-pharmaceutical products is less reliant on GVC connections, with a negative differential between GVC shares and export shares across the 2014-2020 period for both industry groupings.
ICT Services have an overweighed role in GVC-related exports, while non-ICT Services and non-Pharma goods rely on more conventional direct export channels
Figure 4: Differential between Gross Export Share and GVC-related Export Share
Source: Authors’ calculations using OECD ICIO data and the approach of Borin and Mancini (2023).
Accessibility: Get the data in accessible format. (CSV 1.46KB)
Given the importance of ICT services and pharmaceutical product exports to Irish trade, an understanding of the composition of foreign value-added content and primary import destination is relevant for any analysis of trade shocks resulting from changes to tariff or reshoring policies.
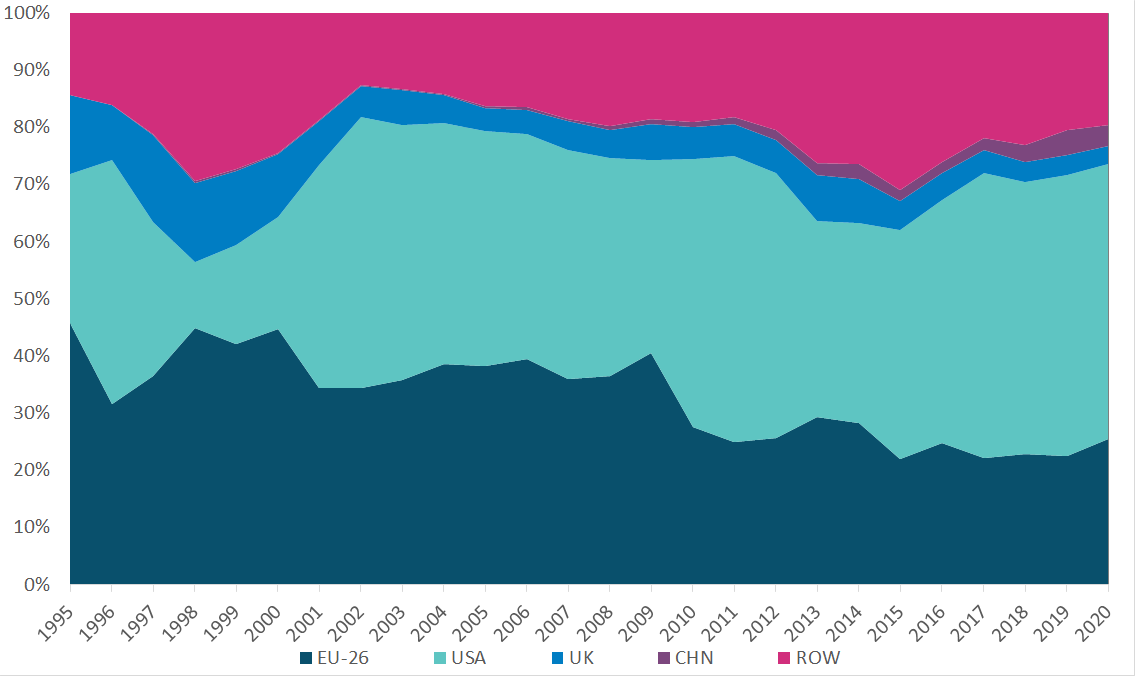
Figure 5 presents the breakdown of Irish pharmaceutical product exports by country of import (Panel A) and by the origin of value-added for the largest import market, the US (Panel B). The chart in Panel A shows the rapid rise in the share of Irish pharmaceutical products being exported to the US during the 1998-2001 period, which has been sustained over the following two decades, coupled with the decline in both EU-26 and UK export shares. In 2020, the US was the primary export market for Irish pharmaceutical export output, with over 48% of all exports from the sector destined for the US.
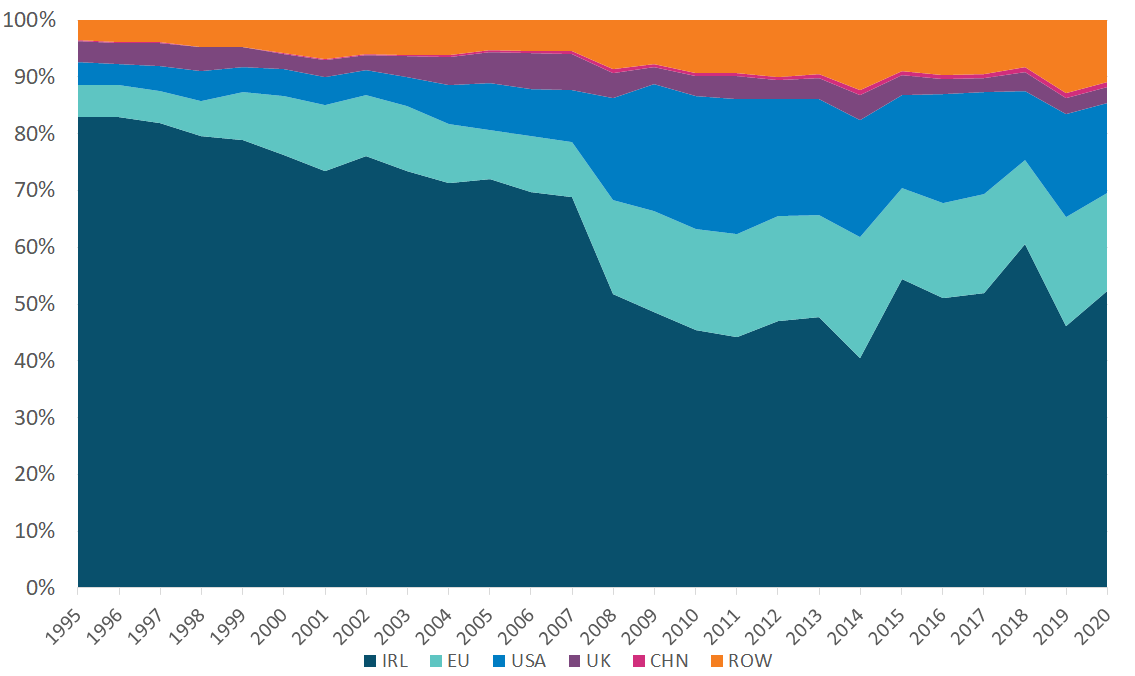
US trade dominates Irish pharmaceutical exports, but the share of Irish value-added in these exports has declined considerably
Figure 5: Geographic and Sectoral Decomposition of Irish Pharmaceuticals Exports
Panel A: Irish Pharma exports by Importing Country
Panel B: Irish Pharma exports to the US by Origin of Value Added
Source: Authors’ calculations using OECD ICIO data.
Accessibility: Get the data in accessible format (5A) (CSV 1.66KB). Get the data in accessible format (5B). (CSV 1.96KB)
However, as shown in Figure 5, Panel B, there has been a stark decline in the domestic value- added component of these exports: in 2020, just over half of total value-added in Irish exports to the US was produced domestically, down from over 80% in 1995. Since 2008, intermediate imports from the US and the EU have accounted for more than one-third of the value added in pharmaceutical exports to the US, showing the reliance of the Irish pharma sector on backwards GVC linkages, and the exposure to risks from global trade shocks.
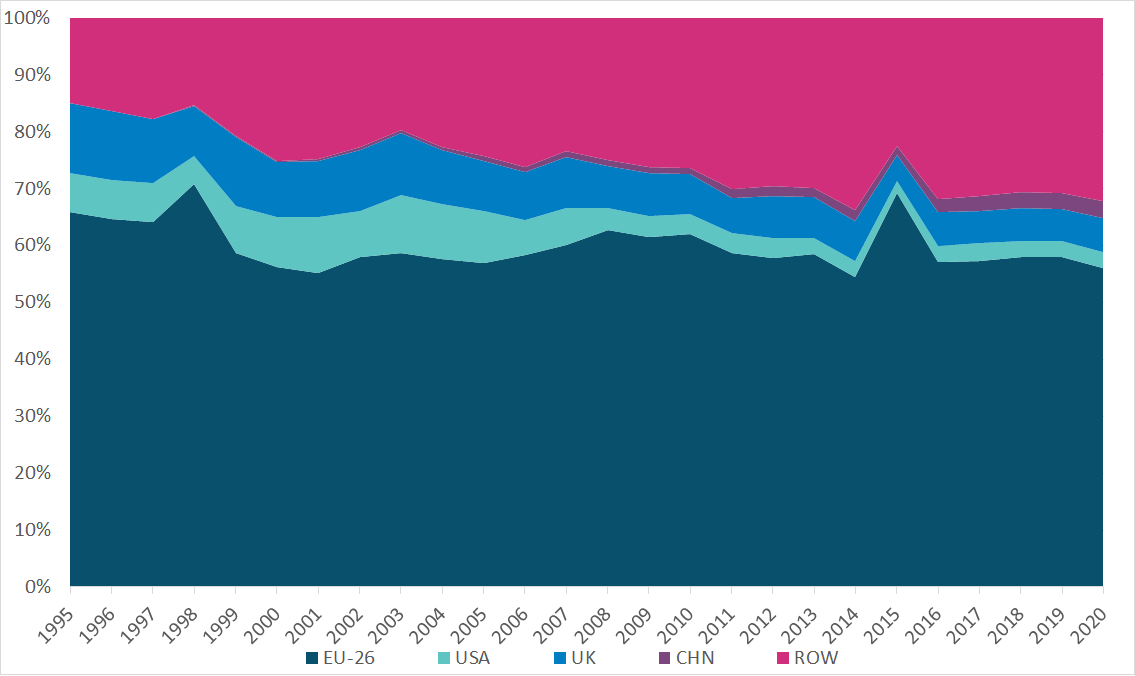
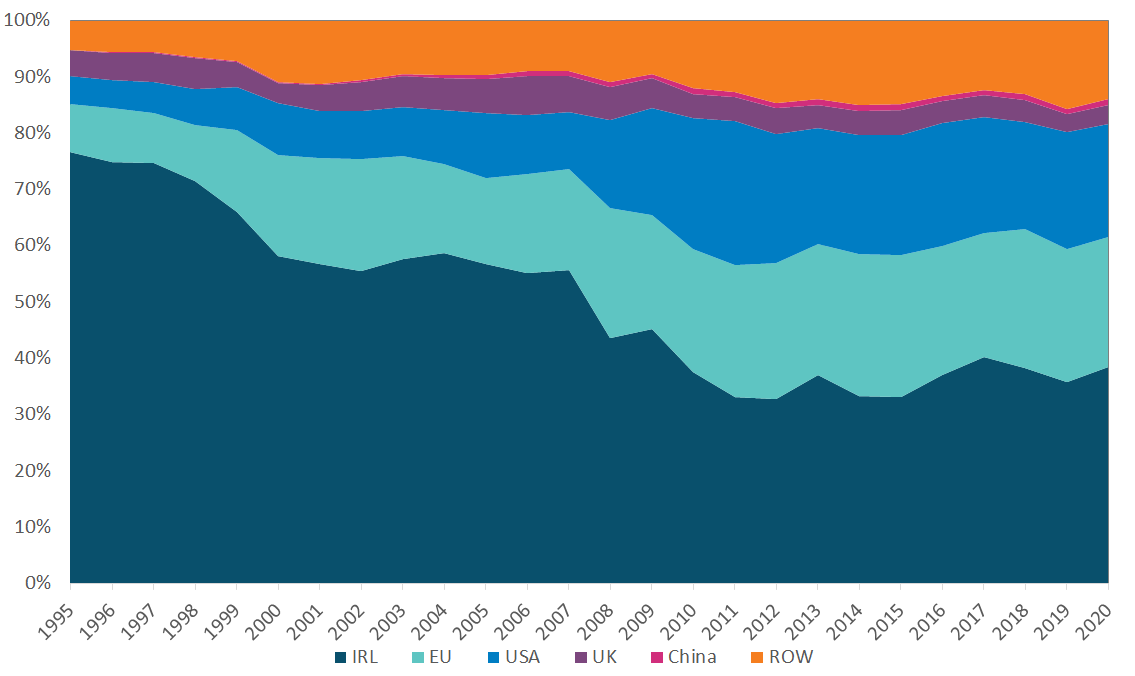
The same decompositions for Irish ICT services exports are presented in Figure 6. Panel A shows the EU-26 to be the primary export destination, with over 56 percent of total ICT services exports sent to the EU in 2020. There is also a persistent trend in exports to the RoW with almost one-third of total ICT exports in 2020.
EU-26 trade accounts for over half of ICT services exports, less than half of the value added in these exports originates in Ireland
Figure 6: Geographic and Sectoral Decomposition of Irish ICT Services Exports
Panel A: Irish ICT Exports by Importer
Panel B: Irish ICT Exports to EU-26 by Origin of Value Added
Source: Authors’ calculations using OECD ICIO data..
Accessibility: Get the data in accessible format (6A). (CSV 1.69KB) Get the data in accessible format (6B). (CSV 1.97KB)
Decomposing the value-added in Irish ICT services exports, Panel B shows a similar trend to the pharmaceutical exports on Figure 5. Over the 1995-2020 period, there has been a marked decline in the share of domestic value-added in ICT exports to the rest of the EU, with less than 40% of the export value added originating in Ireland since 2010. Over the same period, the combined US and EU-27 value added component of ICT exports to the EU has routinely exceeded this domestic contribution, by an average of 10%.
Again, this highlights the dependence of Irish ICT exports on backward GVC linkages, as well as the multi-region origin of intermediate products in Irish exports. Based on the measures of linkages presented in this Insight, any imposition of bilateral tariffs between countries, or a full-scale trade war across trading blocs, has considerable potential to disrupt or impede Irish trade flows in key markets.
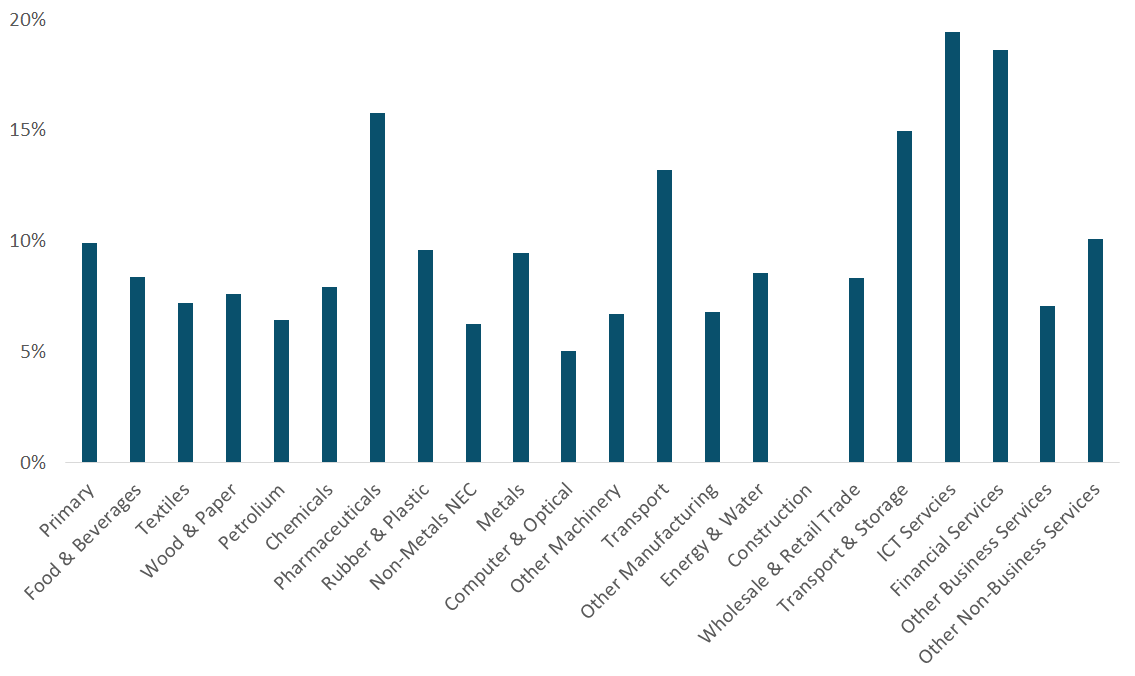
Finally, given the potential for Irish firms to face increased import costs in the event of a retaliatory tariff-based trade war between the US and the EU, Figure 7 presents the share of US intermediate imports incorporated in gross exports across sectors for 2020. For pharmaceutical products, ICT services and financial services, US-origin intermediate imports account for over 15% of the gross export value of each sector in 2020, compared to an average of 7.8% across all other sectors. Given this heightened dependence on US intermediates, it is likely that these three sectors would face steeper price rises in the event of retaliatory tariffs, or other measures, being imposed on imported US products by the EU.
MNE dominated industries have above-average dependence on US-origin intermediates
Figure 7: Share of US Intermediaries in Exports by Sector (2020)
Source: Authors’ calculations using OECD ICIO data and the approach of Borin and Mancini (2023).
Notes: Export intermediates estimates derived from OECD calculations for gross exports by origin of value added.
Accessibility: Get the data in accessible format. (CSV 0.93KB)
Tariff Scenarios and their Effects on the Irish Economy
The Model
In this section, we employ an open-economy general-equilibrium model with production networks, following Baqaee and Farhi (2024), and adapt it to capture the distinctive features of the Irish economy outlined in the previous section. We use the model to evaluate the effects of the recent trade agreement between the EU and the United States, which forms part of a broader US policy on import tariffs initially introduced as the “Liberation Day” tariffs. In addition, we study the effects of several alternative tariff scenarios.
The model covers five regions—Ireland, the EU excluding Ireland, the UK, the US, and China—plus a residual Rest of the World (RoW) bloc, and is calibrated to 2019 using the OECD’s Inter-Country Input–Output (ICIO) data. Each country comprises 16 production sectors that use both primary factors (capital and labour) and intermediate inputs.
The model incorporates a rich production-network structure, which is essential to capture how tariffs propagate through global value chains. At the same time, the model is static: we can study the new long-run state of the economy under the tariff regime, but not the transitional dynamics leading to it or the effects of short-term mitigation policies. Capital and labour are mobile across sectors within each country but immobile across countries.[6] Intermediate goods can be sourced from any sector in any country, allowing the formation of global value chains.
Households supply labour inelastically and derive utility solely from consumption. As a result, household welfare corresponds directly to real consumption in response to tariff shocks. Following Baqaee and Farhi (2024), we decompose the welfare impact into two parts: (i) a factor reallocation effect, capturing gains or losses from shifting labour and capital across sectors, and (ii) a level effect, reflecting sectoral productivity changes while holding factor allocation fixed. This decomposition allows us to identify the channels through which tariffs affect welfare. Finally, firms are assumed to be owned by households in each country, so both firm profits and tariff revenues are rebated domestically.[7]
Overall, this framework is well suited to evaluating the impact of tariffs, as it captures both the direct effects on Irish production and the indirect substitution channels that operate through international input–output linkages. Asymmetric tariff rates across countries and sectors can redirect trade flows and reallocate resources across industries, amplifying or dampening the overall economic impact.
Tariff Scenarios and Results
We assess the potential future impact of the recently announced US-EU trade agreement, which followed rounds of negotiation after the initial “Liberation Day” tariff proposal by the United States. Under this agreement, the US imposes a 15 per cent import tariff on selected industrial goods from the European Union, with no retaliatory measures adopted by the EU. In parallel, we incorporate broader “Liberation Day” tariffs, consisting of a 35 per cent symmetric tariff between the US and China and a 10 per cent symmetric tariff between the US and the Rest of the World (RoW), including the UK.
A key advantage of our production-network framework is that it allows us to accommodate tariffs imposed on specific sectors, closely replicating the sectoral scope of the actual agreement. In our model, tariffs apply only to the goods-producing sectors, while services remain exempt. Additionally, we study alternative trade policy scenarios, including symmetric retaliation, tariffs on all sectors, and higher tariffs on selected high-value sectors.[8]
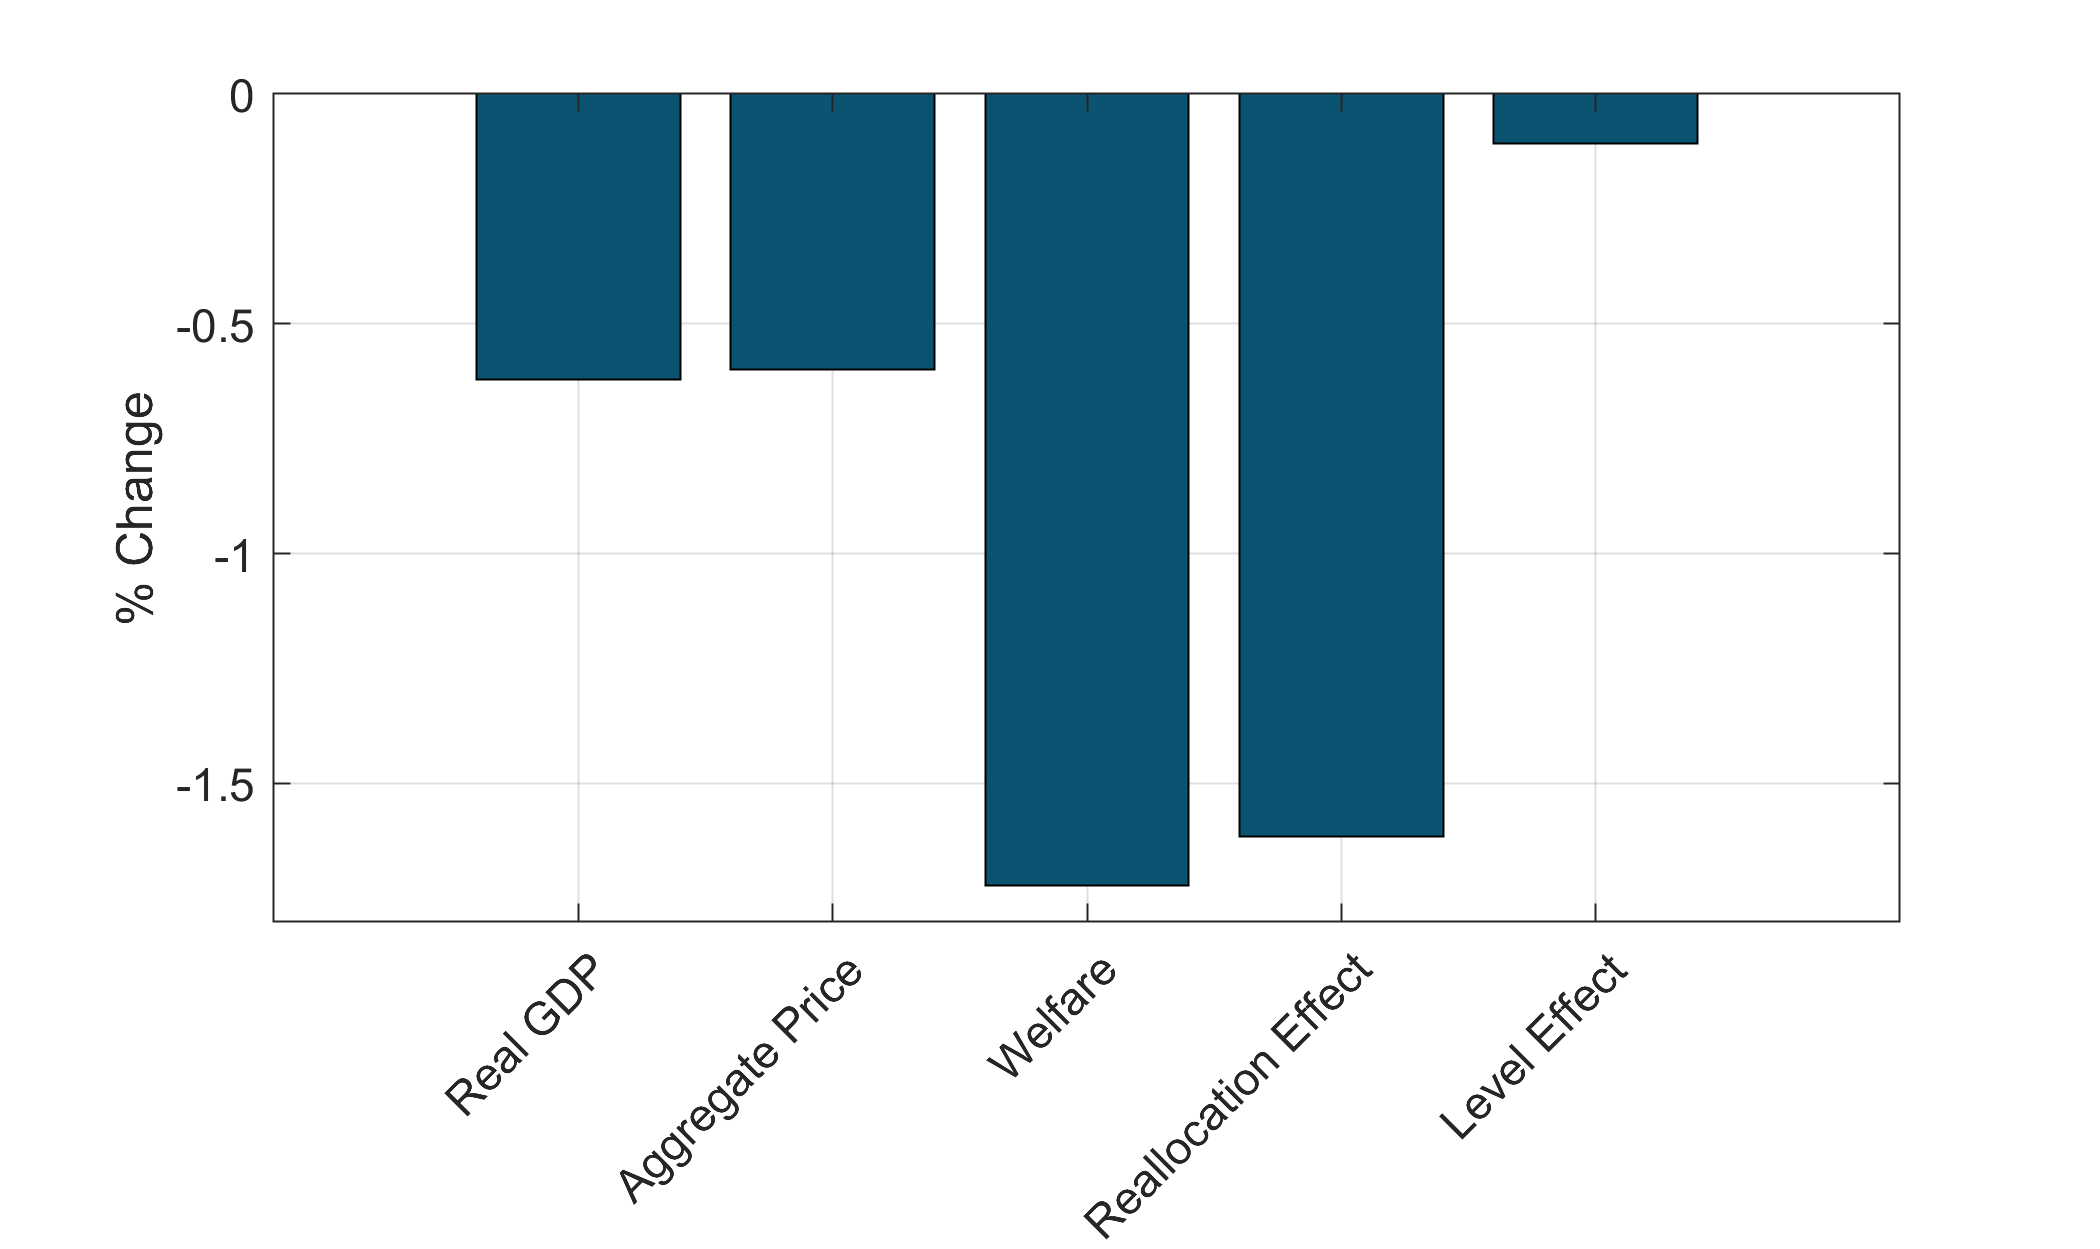
Figure 8 presents the predicted long-run macroeconomic impact of the recently announced US- EU trade agreement on the Irish economy. We report changes in real GDP, prices as measured by the consumer price index, and household welfare, broken down into the reallocation and level effects.
Aggregate effects of import tariffs on the Irish economy are negative but moderate
Figure 8: Aggregate Effects on the Irish Economy
Source: Authors’ calculations using OECD ICIO data and the model from Baqaee and Farhi (2024).
Notes: This figure presents the impact of the recently announced US-EU trade agreement on aggregate Irish variables: real GDP, prices, and household welfare (decomposed into reallocation and level effects). The scenario assumes a 15 per cent US import tariff on manufactured goods from the European Union, with no EU retaliation, in addition to 35 per cent symmetric tariff between the US and China and a 10 per cent symmetric tariff between the US and the Rest of the World (RoW), incl. the UK. All values are expressed as percentage changes.
Accessibility: Get the data in accessible format. (CSV 1.9KB)
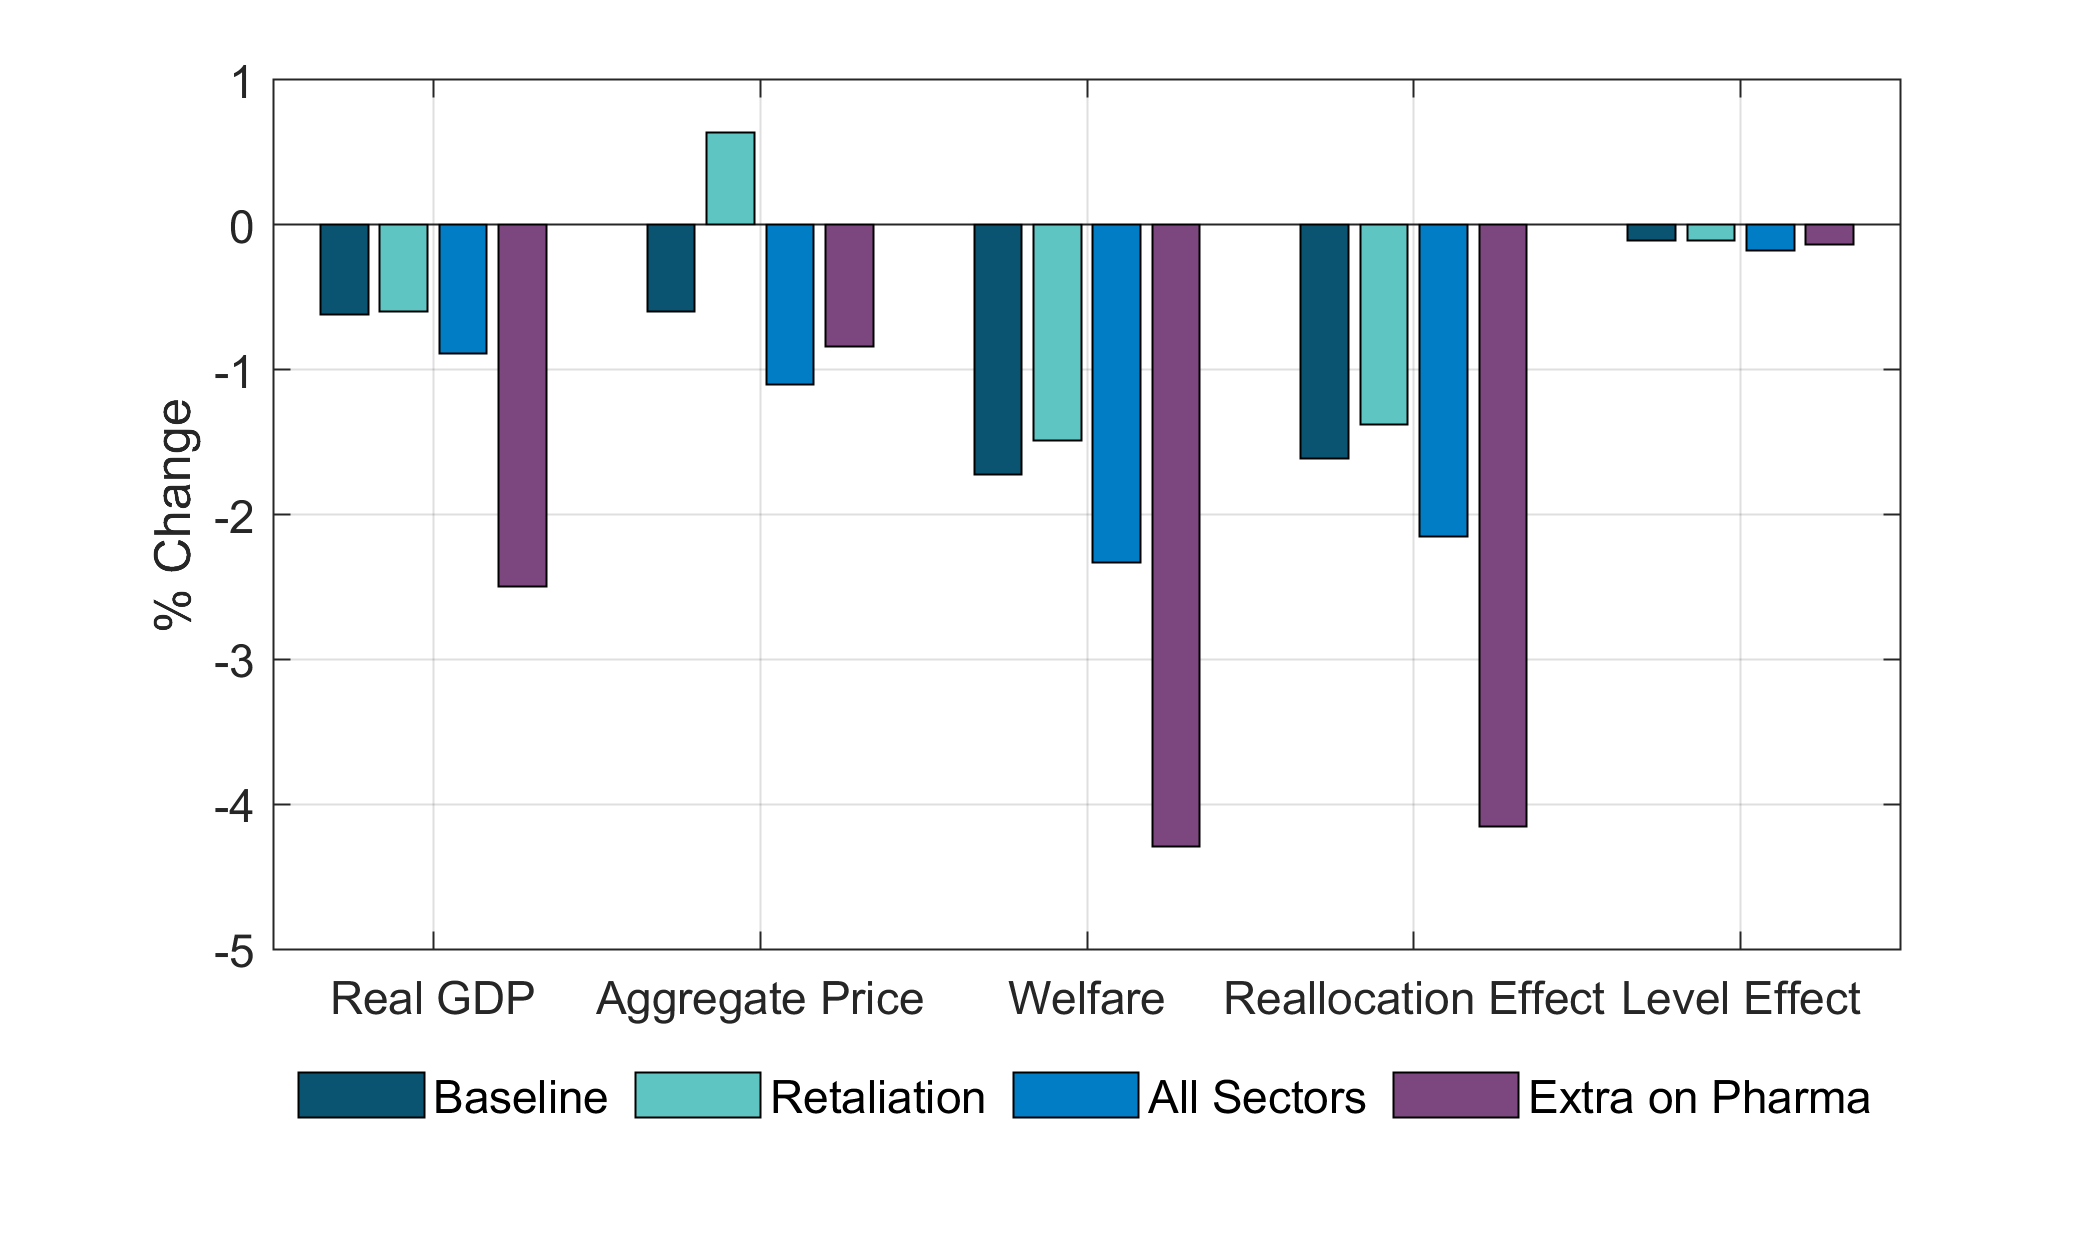
The model predicts negative but moderate effects on the Irish economy. Real GDP declines by approximately 0.6 per cent, while aggregate prices fall by less than 1 per cent. As shown in Figure B.1 in Appendix B, only in scenarios with retaliation do supply chain disruptions and redirected domestic demand shift the shock from deflationary to inflationary.
Household welfare declines by around 1.7 per cent reflecting both the decline in real GDP and adverse movements in the relative prices of internationally traded goods. We observe strong reallocation effects suggesting that the new tariff shifts activity into less productive, typically less externally traded sectors of the economy, which underpins the overall reduction in economic activity, household income, and consumption. By contrast, the level effect – a direct reduction in productivity – accounts for only a small fraction of the total welfare reduction. In other words, the imposed tariff disproportionately reduces activity in Ireland’s highly specialised, export-intensive sectors and shifts resources into less-traded activities such as Professional Services and Public Administration, weakening aggregate efficiency.
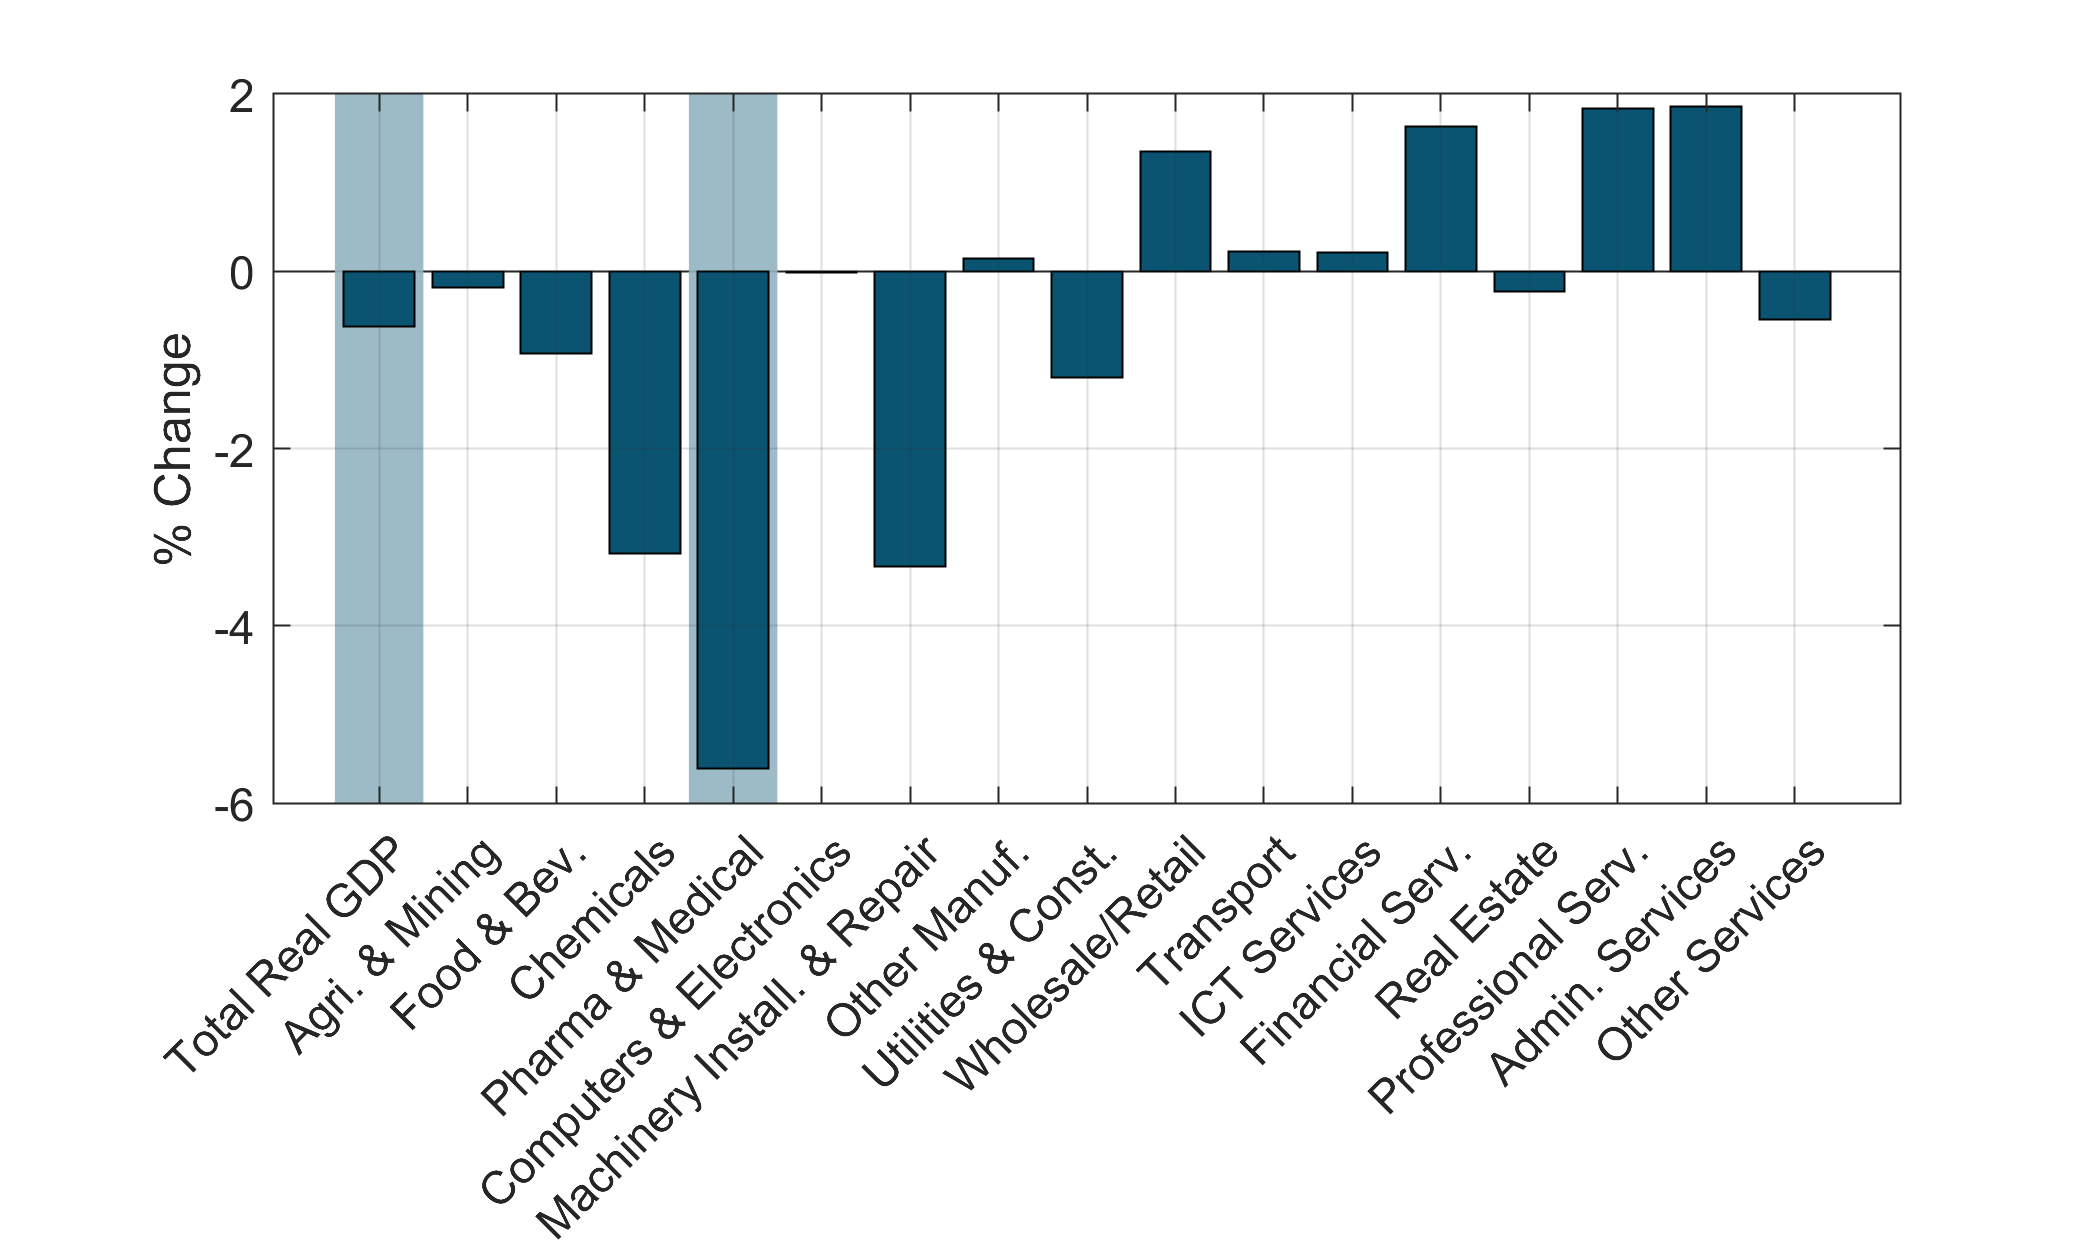
In particular, Ireland’s high-value goods sectors — especially ’Pharmaceuticals’ and ’Chemicals’ — are the most affected by tariffs due to their deep integration into global value chains (Figure 9). Other goods-producing sectors also contract, including ’Machinery install. & Repair’, which is closely linked to export-intensive industries such as ’Pharmaceuticals’ and ’Computers & Electronics’; and ’Food & Bev.’, an indigenous industry where profits are retained domestically rather than repatriated abroad.[9] As these industries rely on complex cross-border networks for parts and materials, the model captures strong propagation effects from the disruption of global value chains, whereby tariff-induced frictions raise costs reducing sectors’ competitiveness throughout the network.
At the sectoral level, import tariffs generate significant variation, with Pharmaceuticals driving the decline in Irish output
Figure 9: Absolute Irish Sectoral Real Output Changes
Source: Authors’ calculations using OECD ICIO data and the model from Baqaee and Farhi (2024)
Notes: This figure presents absolute changes in real GDP by sector in Ireland. The scenario assumes a 15 per cent US import tariff on manufactured goods from the European Union, with no EU retaliation, in addition to 35 per cent symmetric tariff between the US and China and a 10 per cent symmetric tariff between the US and the Rest of the World (RoW), incl. the UK. All values are expressed as percentage changes.
Accessibility: Get the data in accessible format. (CSV 0.42KB)
By contrast, several services sectors expand modestly, including 'Financial Serv.', 'Professional Serv.', and 'Admin. Services'. These sectors are not directly subject to tariffs but benefit indirectly as labour and capital reallocate away from contracting goods industries and as domestic demand shifts towards non-traded, tariff-exempt activities. However, because many of these sectors account for only a small share of Irish output, the aggregate weighted response still results in an overall GDP loss of 0.6 per cent, with the pharmaceuticals contributing the largest share of the decline.
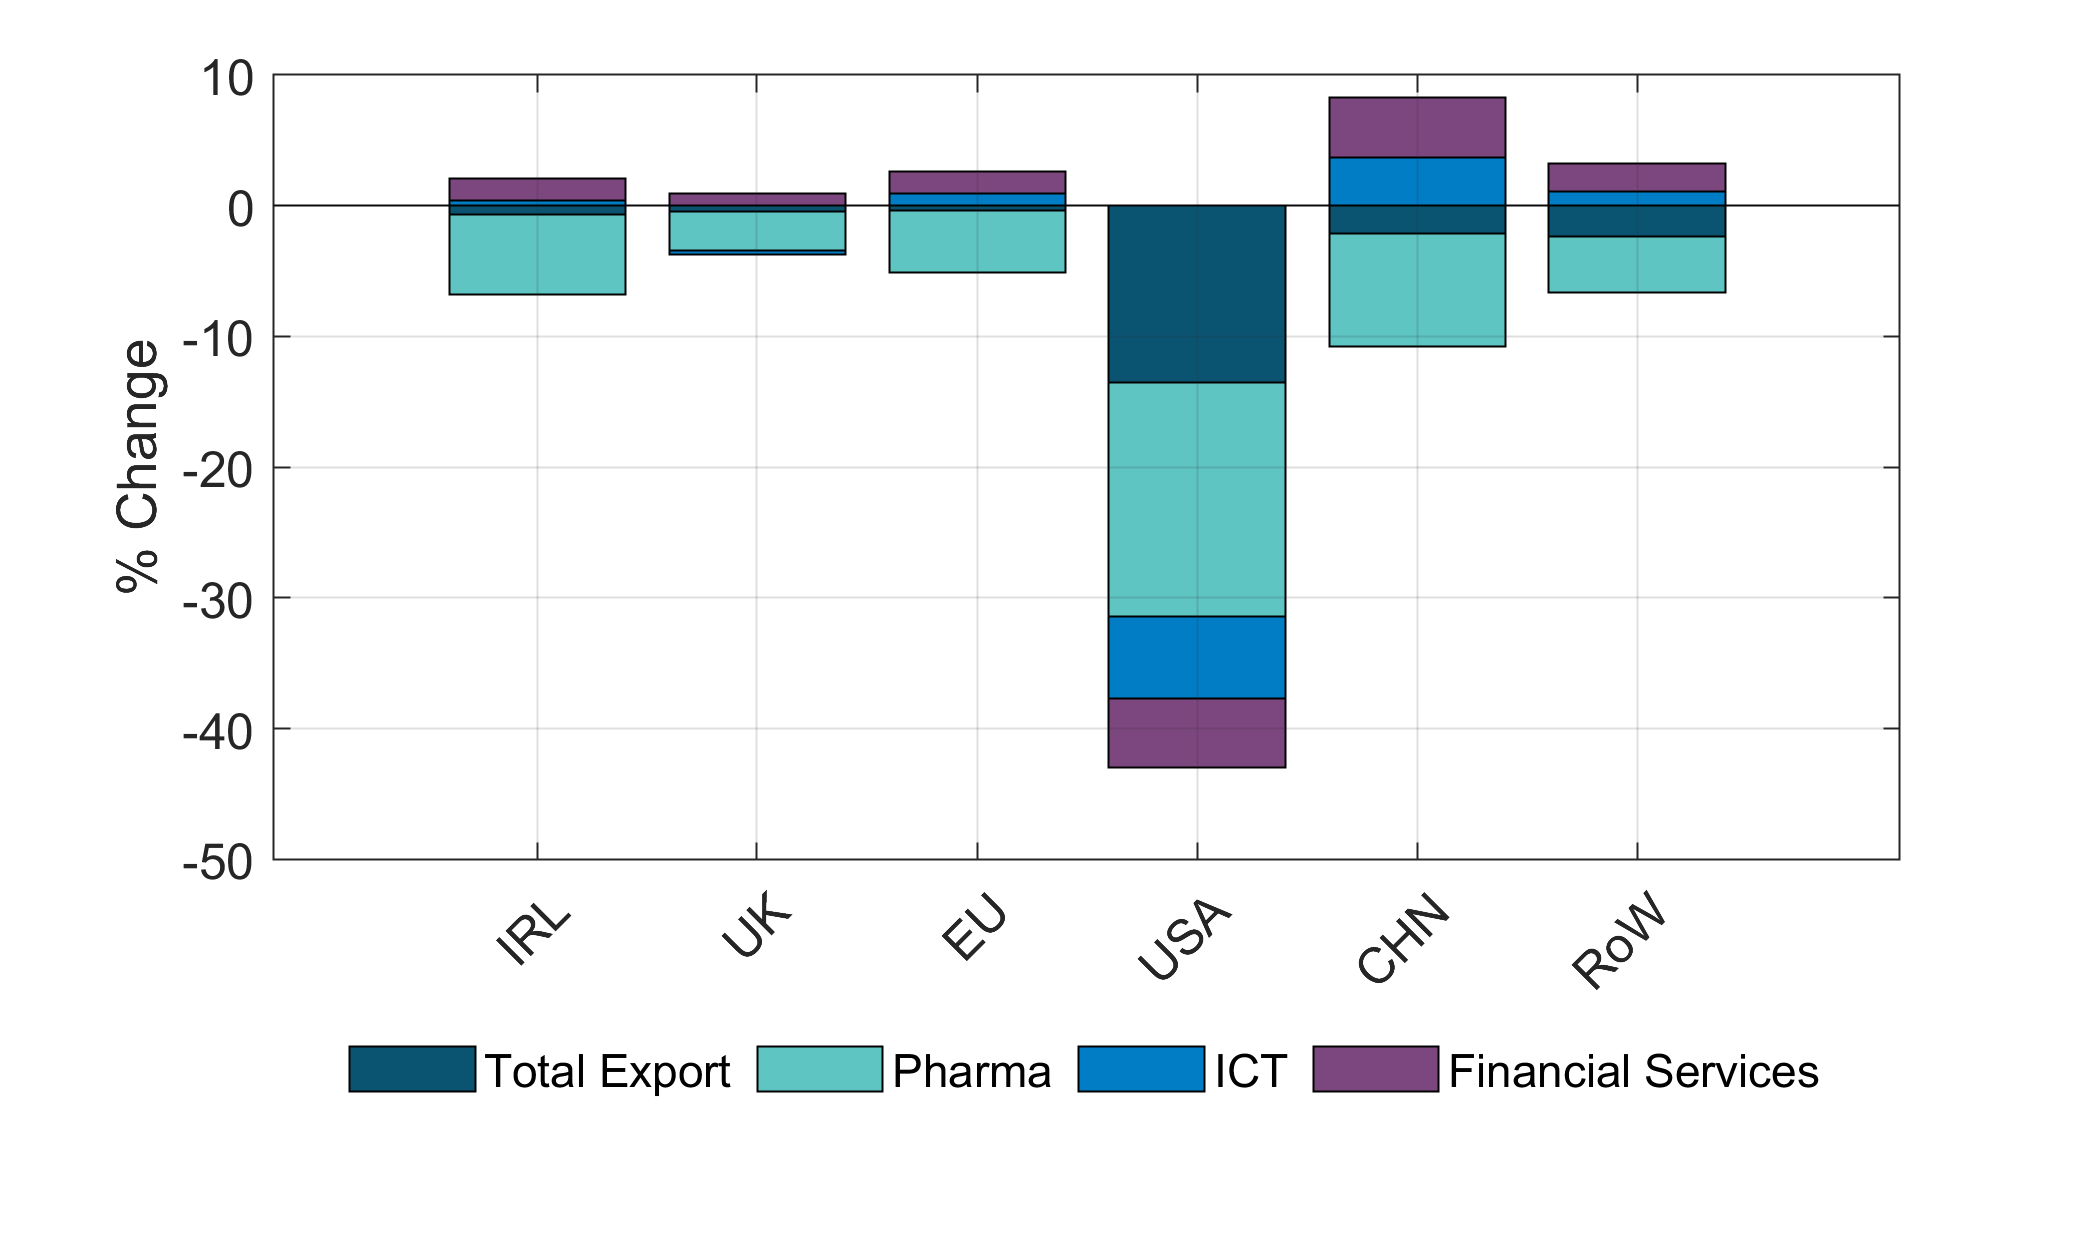
Irish exports fall by around 0.7 per cent (Figure 10), with Pharmaceuticals the hardest-hit sector. Cross-country comparisons show pharmaceutical exports decline everywhere, indicating a global contraction in export markets and no evidence of trade diversion. By contrast, ICT and Financial Services expand in most countries (except the US), cushioning some of the losses. While trade wars often raise expectations of diversion—where third countries gain from redirected export flows—our model finds little evidence of such benefits for Ireland. Overall, the results suggest that Ireland’s highly globalised goods sectors remain especially exposed to trade shocks, while its services base enhances resilience but cannot offset the concentrated risks in pharmaceuticals.[10]
Export markets contract globally in response to import tariffs, with little evidence of trade diversion
Figure 10: Absolute Change in Real Export by Sector
Source: Authors’ calculations using OECD ICIO data and the model from Baqaee and Farhi (2024).
Notes. This figure shows the percentage change in Ireland’s real exports, disaggregated by selected sectors (Chemicals, Pharmaceuticals, ICT and Financial Services) alongside the aggregate total. The scenario assumes a 15 per cent US import tariff on manufactured goods from the EU, with no EU retaliation, in addition to 35 per cent symmetric tariff between the US and China and a 10 per cent symmetric tariff between the US and the Rest of the World (RoW), incl. the UK. All values are expressed as percentage changes.
Accessibility: Get the data in accessible format. (CSV 0.36KB)
Alternative Tariff Scenarios
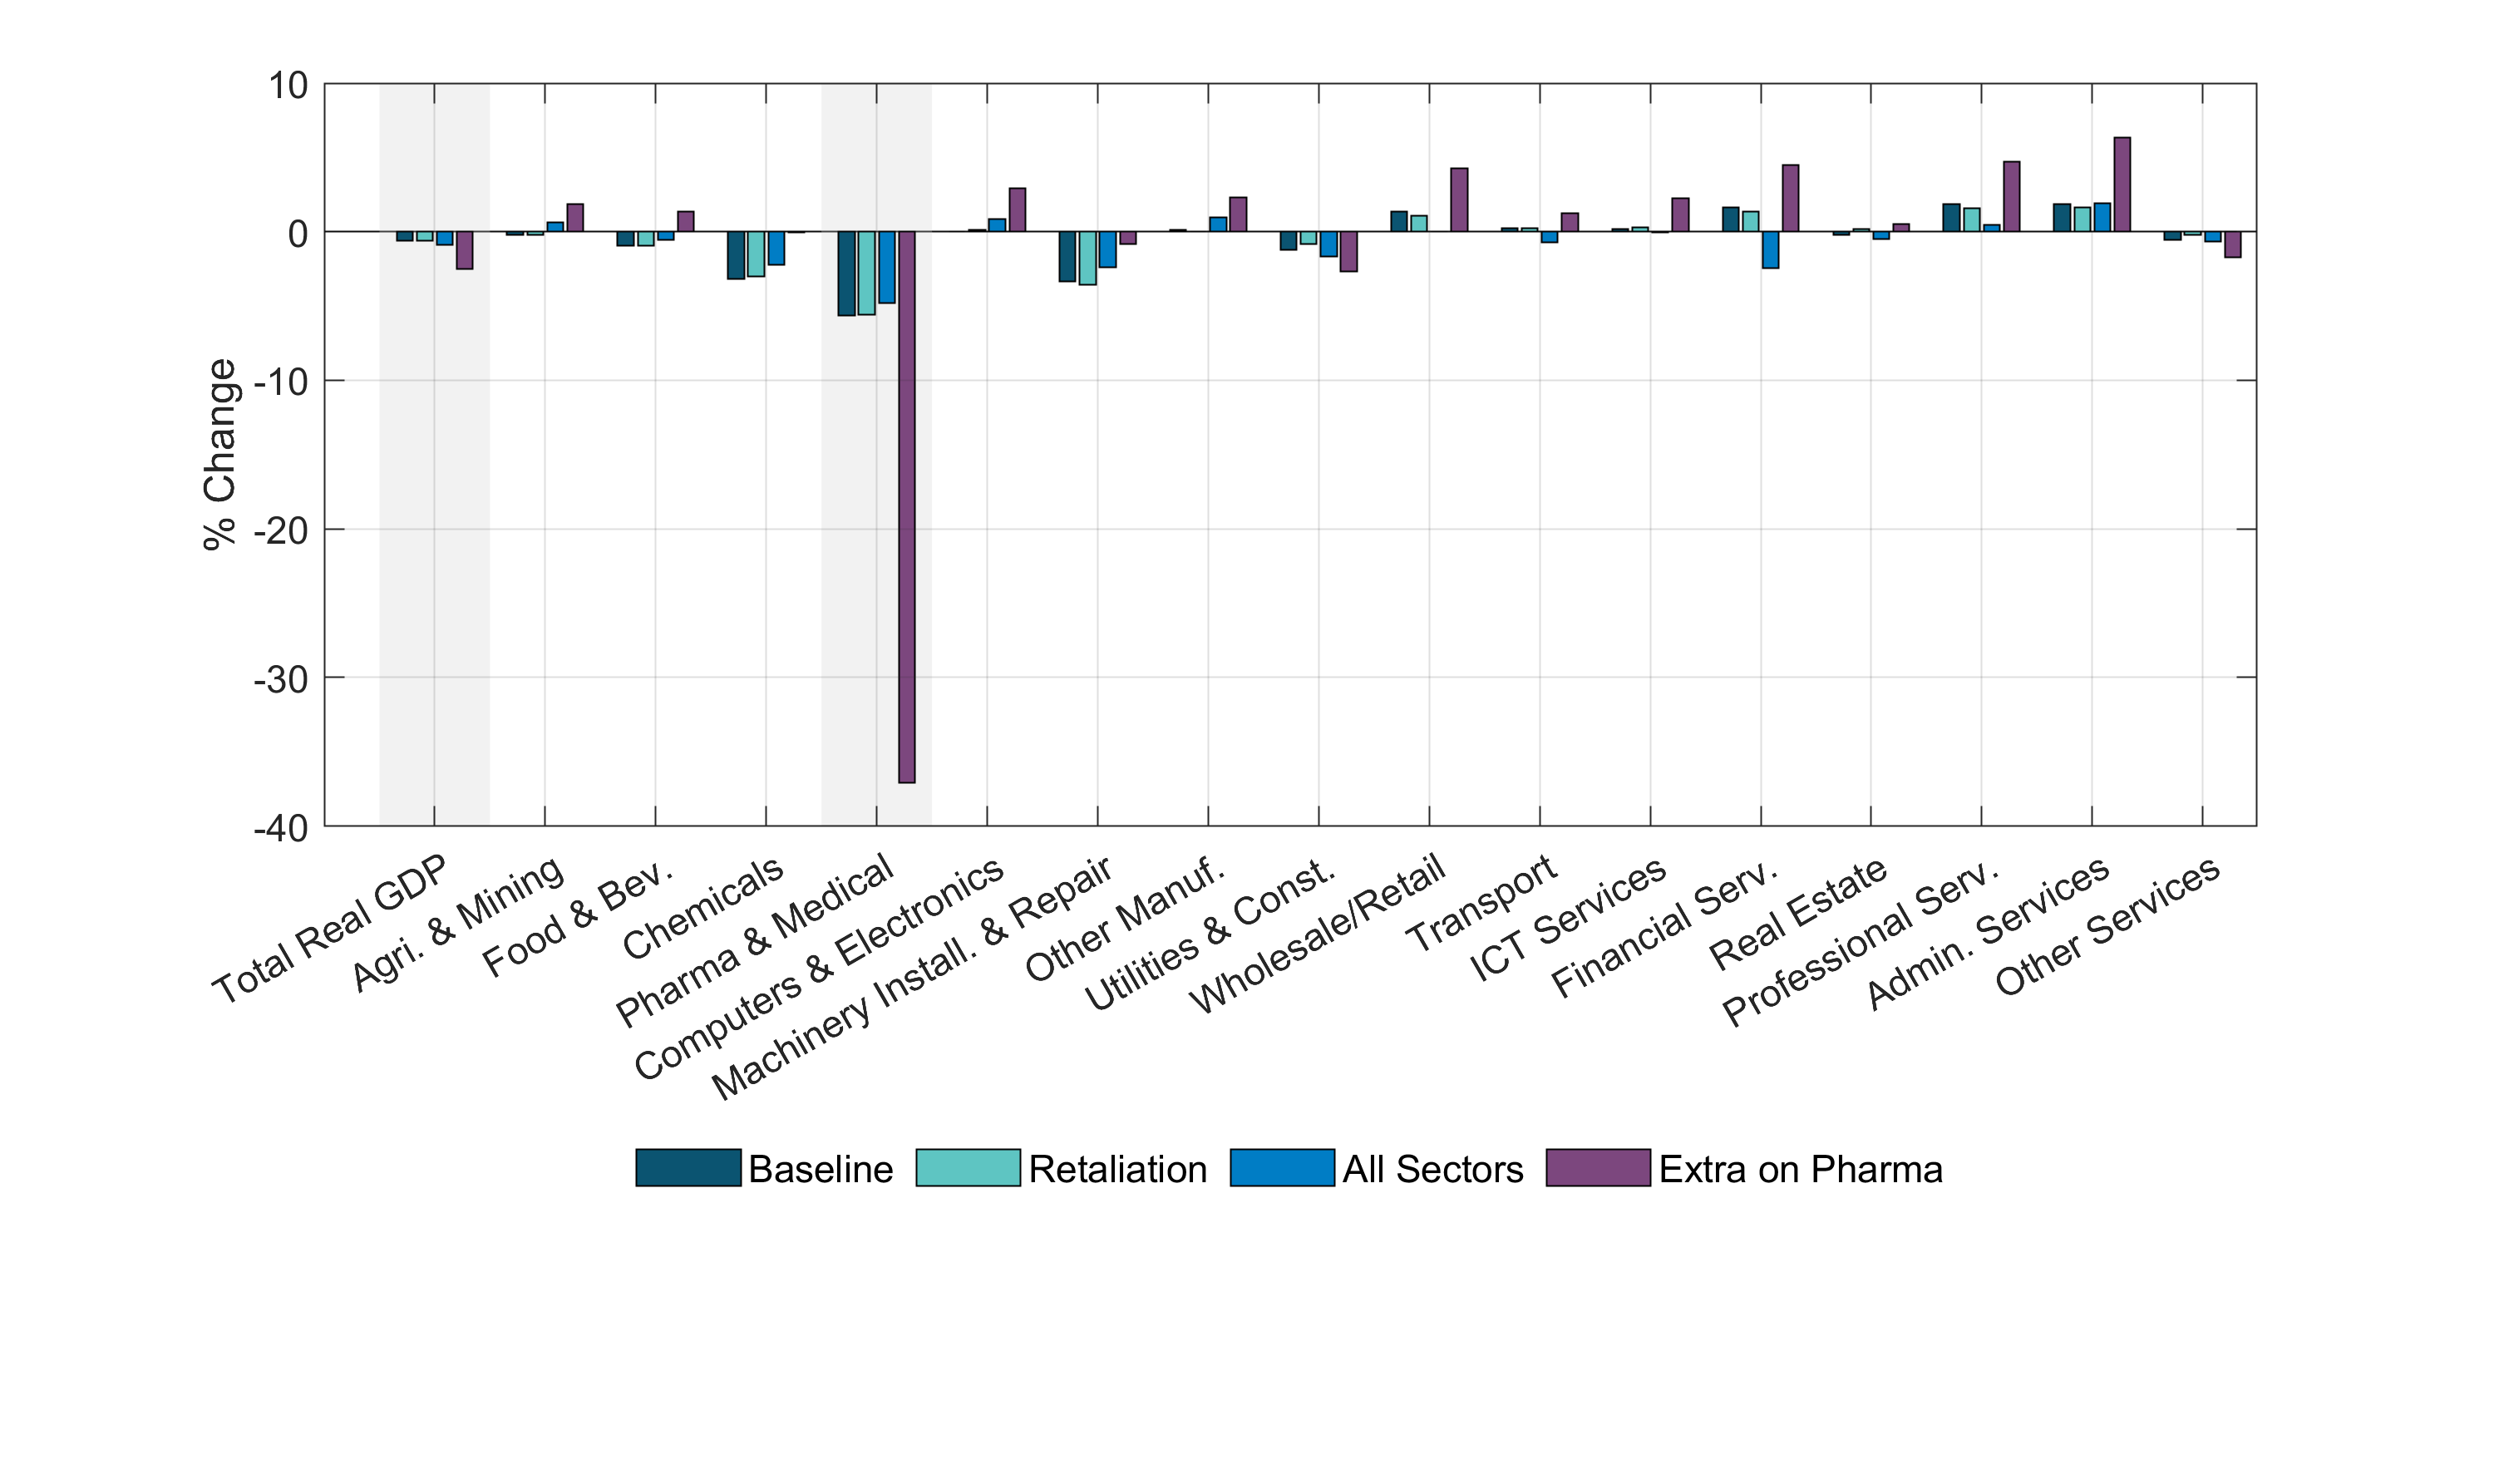
The main results are qualitatively robust across a range of alternative tariff scenarios. In Appendix B, we present results for several such cases, benchmarked against the agreed US–EU trade deal (the Baseline). The Retaliation scenario introduces symmetric retaliatory tariffs on US ex- ports. The All Sectors scenario extends the baseline tariff schedule to all sectors (goods and services), with no retaliation. The Extra on Pharma scenario adds 35 percentage points to the baseline tariff on pharmaceutical products, bringing the total to 50 per cent, again without retaliation. Tariffs between the US and other countries remain unchanged across scenarios.
Three main findings stand out. First, under EU retaliation, Irish prices rise (Figure B.1), but this comes at the cost of lower real GDP due to broader supply chain disruptions. Second, when tariffs are extended to all sectors — including services — all of Ireland’s high-value sectors (Pharmaceuticals, ICT, and Financial Services) experience declines, resulting in larger GDP and welfare losses (Figure B.2). Third, the additional 35 per cent tariff on pharmaceuticals produces the most adverse outcome for Ireland, leading to a contraction in the sector of over 4 per cent (and over 35 per cent in absolute terms, Figure B.3) and exacerbating the overall macroeconomic impact.
Conclusion
Ireland’s deep integration into global value chains has been a cornerstone of industrial policy since the early 1990s. The active recruitment of export-oriented, high-value-added MNEs (Multinational Enterprises) has supported exceptional output growth over a sustained period, but also exposes the Irish economy to shocks in key sectors due to rising trade fragmentation.
Our empirical analysis reveals strong sectoral and geographic dependencies, with several key industries heavily exposed to negative trade policy shocks. Relative to other EU economies, GVC reliance exposes certain sectors to both downstream production and final demand conditions that can be negatively affected by foreign trade policy, in the form of heightened tariffs or other non-tariff barriers. While these external exposures are present across a number of sectors, pharmaceutical products are particularly exposed to changes in US trade policy.
Our general-equilibrium model suggests negative effects on the Irish economy under the recent US–EU trade agreement, when considered alongside other tariffs imposed by the United States on its trading partners following the US Liberation Day tariff announcement. Real GDP declines by approximately 0.6 per cent, while household welfare falls by around 1.7 per cent. These effects are driven primarily by a contraction in the pharmaceutical sector — one of Ireland’s most export- dependent industries. In contrast, high-value services such as ICT and financial services help to offset some of the losses. Given the low labour intensity in pharmaceutical production, the adverse effects are transmitted mainly through the reallocation of labour and capital. This shift towards less-productive sectors is the key driver of the welfare decline, as confirmed by the model’s large negative reallocation effect. While the model provides valuable insights into how tariff shocks propagate across sectors and trade networks, it has important limitations. In particular, its static structure and the assumption of capital and labour immobility preclude analysis of transitional dynamics — a period when mitigation policies and market adjustments are especially relevant. For this reason, the results should be interpreted with caution, and it might be useful to view them alongside evidence from complementary modelling approaches, such as more aggregate Dynamic Stochastic General Equilibrium Model (DSGE) models, to cross-check robustness.
References
Baqaee, D. R. and Farhi, E. (2024). Networks, barriers, and trade. Econometrica, 92(2):341–373.
Borin, A. and Mancini, M. (2023). Measuring what matters in value-added trade. Economic Systems Research, 35(4):586–613.
Gereffi, G. and Fernandez-Stark, K. (2011). Global Value Chain Analysis: A Primer. Center on Globalization, Governance & Competitiveness.
Appendix
A. Baseline Scenario: Additional Results
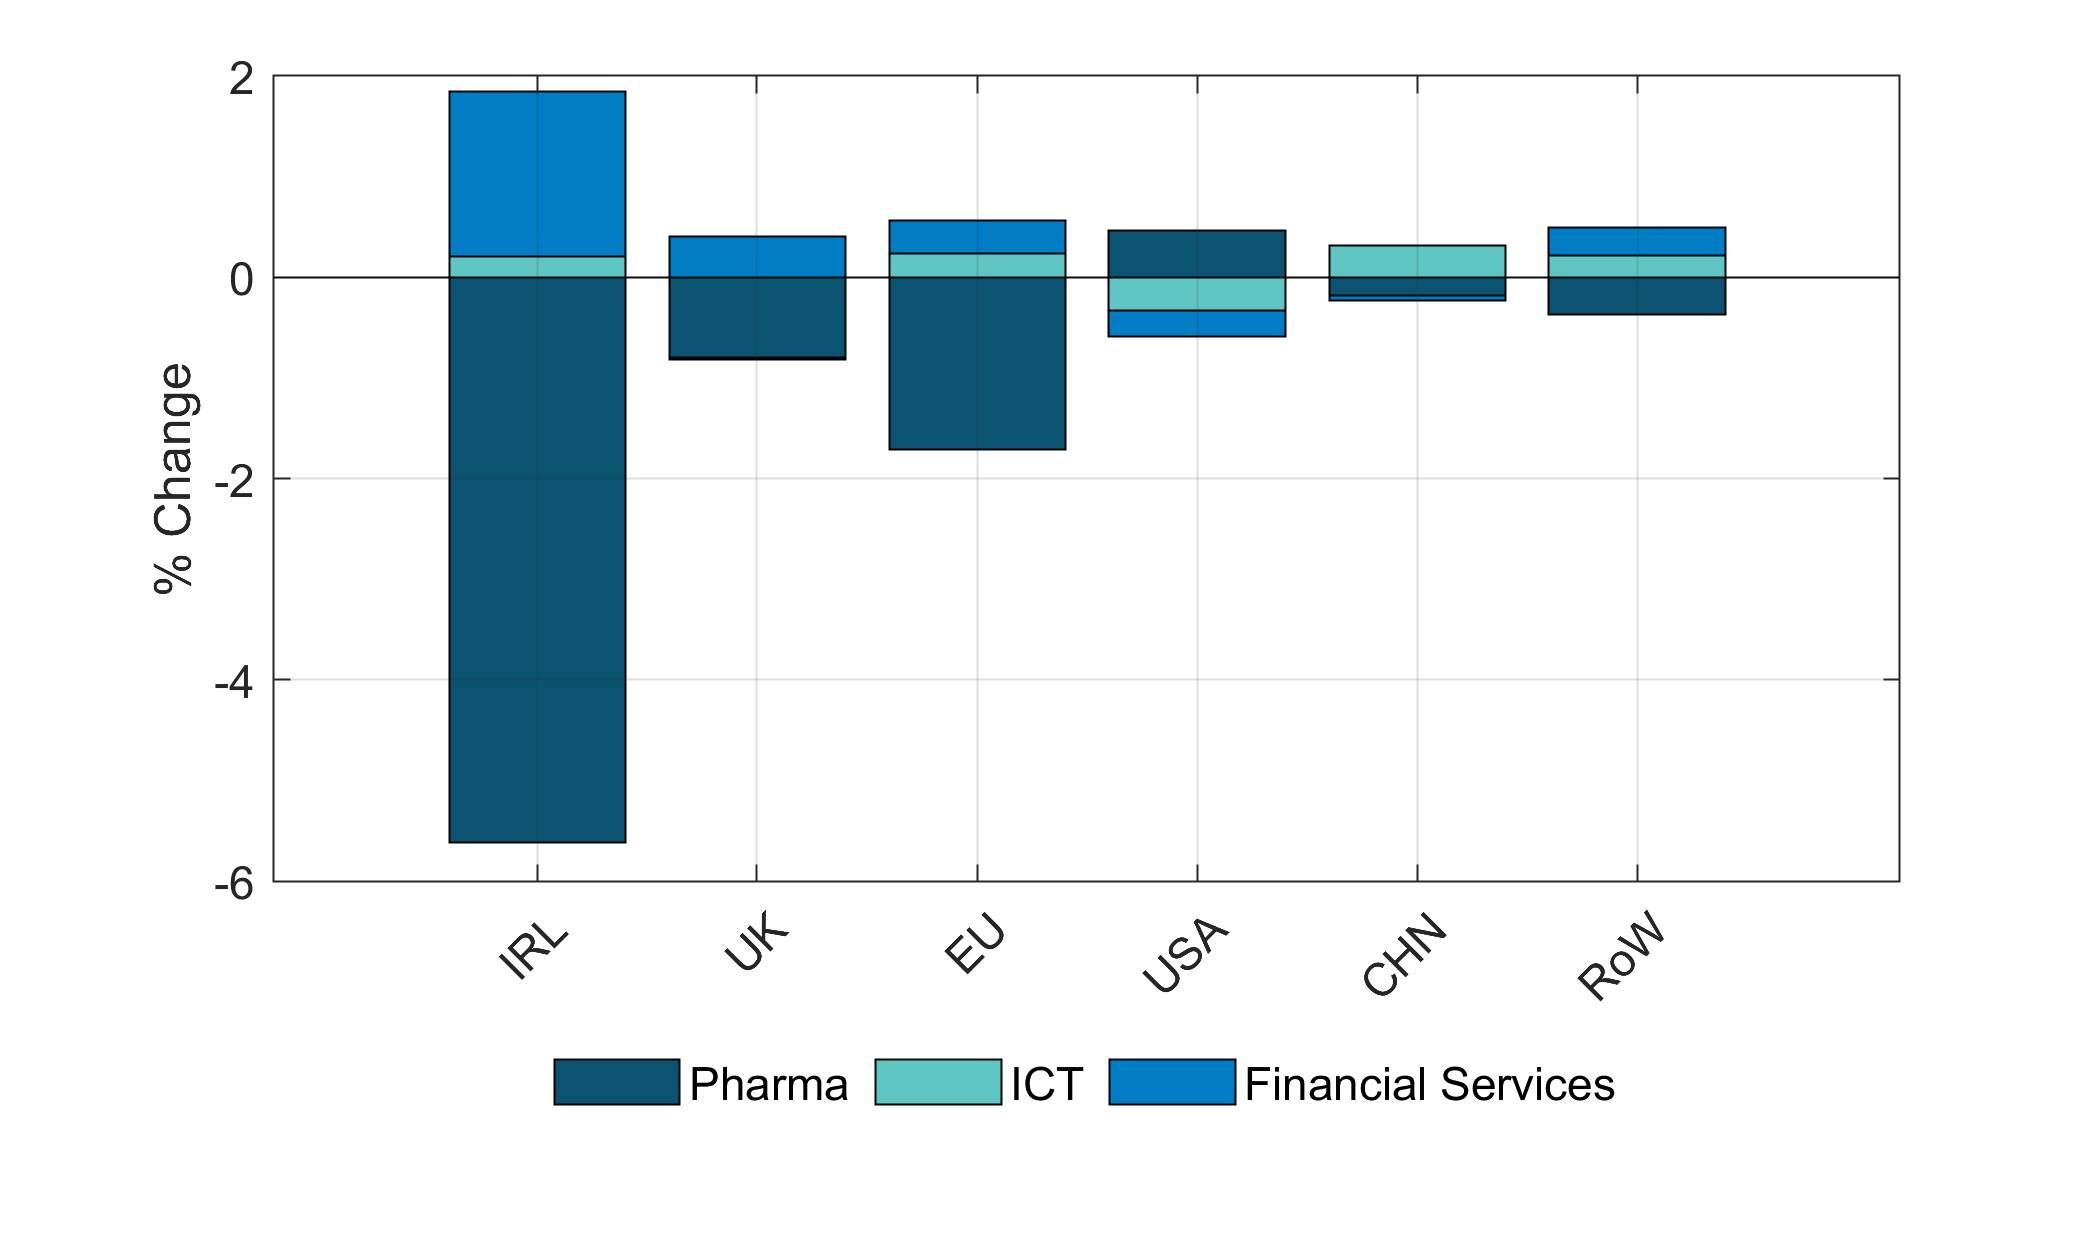
Figure A.1: Absolute Change in Real Value Added for Key Sectors Across Countries
Source: Authors’ calculations using OECD ICIO data and the model from Baqaee and Farhi (2024).
Notes: This figure presents absolute changes in real value added across countries (Ireland, the UK, the EU excl. Ireland, the US, China and the RoW). The scenario assumes a 15 per cent US import tariff on manufactured goods from the EU, with no EU retaliation, in addition to 35 per cent symmetric tariff between the US and China and a 10 per cent symmetric tariff between the US and the Rest of the World (RoW), incl. the UK. All values are expressed as percentage changes.
Accessibility: Get the data in accessible format. (CSV 0.27KB)
B. Alternative Tariff Scenarios
Figure B.1: Alternative Tariff Scenarios: Aggregate Effects
Source: Authors’ calculations using OECD ICIO data and the model from Baqaee and Farhi (2024).
Notes: This figure presents the effects of tariffs on aggregate Irish variables: real GDP, prices, and household welfare (including both reallocation and level effects). The tariff scenarios are: blue represents the baseline scenario; red adds symmetric retaliation; yellow imposes baseline tariffs on all sectors; and purple includes an additional 50 per cent tariff on pharmaceuticals on top of the baseline. All values are shown as percentage changes.
Accessibility: Get the data in accessible format. (CSV 0.35KB)
Figure B.2: Alternative Tariff Scenarios Absolute Irish Sectoral Real Output Changes
Source: Authors’ calculations using OECD ICIO data and the model from Baqaee and Farhi (2024).
Notes: This figure presents absolute changes in real GDP by sector in Ireland across four tariff scenarios. The tariff scenarios are: blue represents the baseline scenario; red adds symmetric retaliation; yellow imposes baseline tariffs on all sectors; and purple includes an additional 50 per cent tariff on pharmaceuticals on top of the baseline. All values are expressed as percentage changes.
Accessibility: Get the data in accessible format. (CSV 0.35KB)
Figure B.3: Alternative Tariff Scenarios: Absolute Change in Real Value Added for Key Sectors across Countries
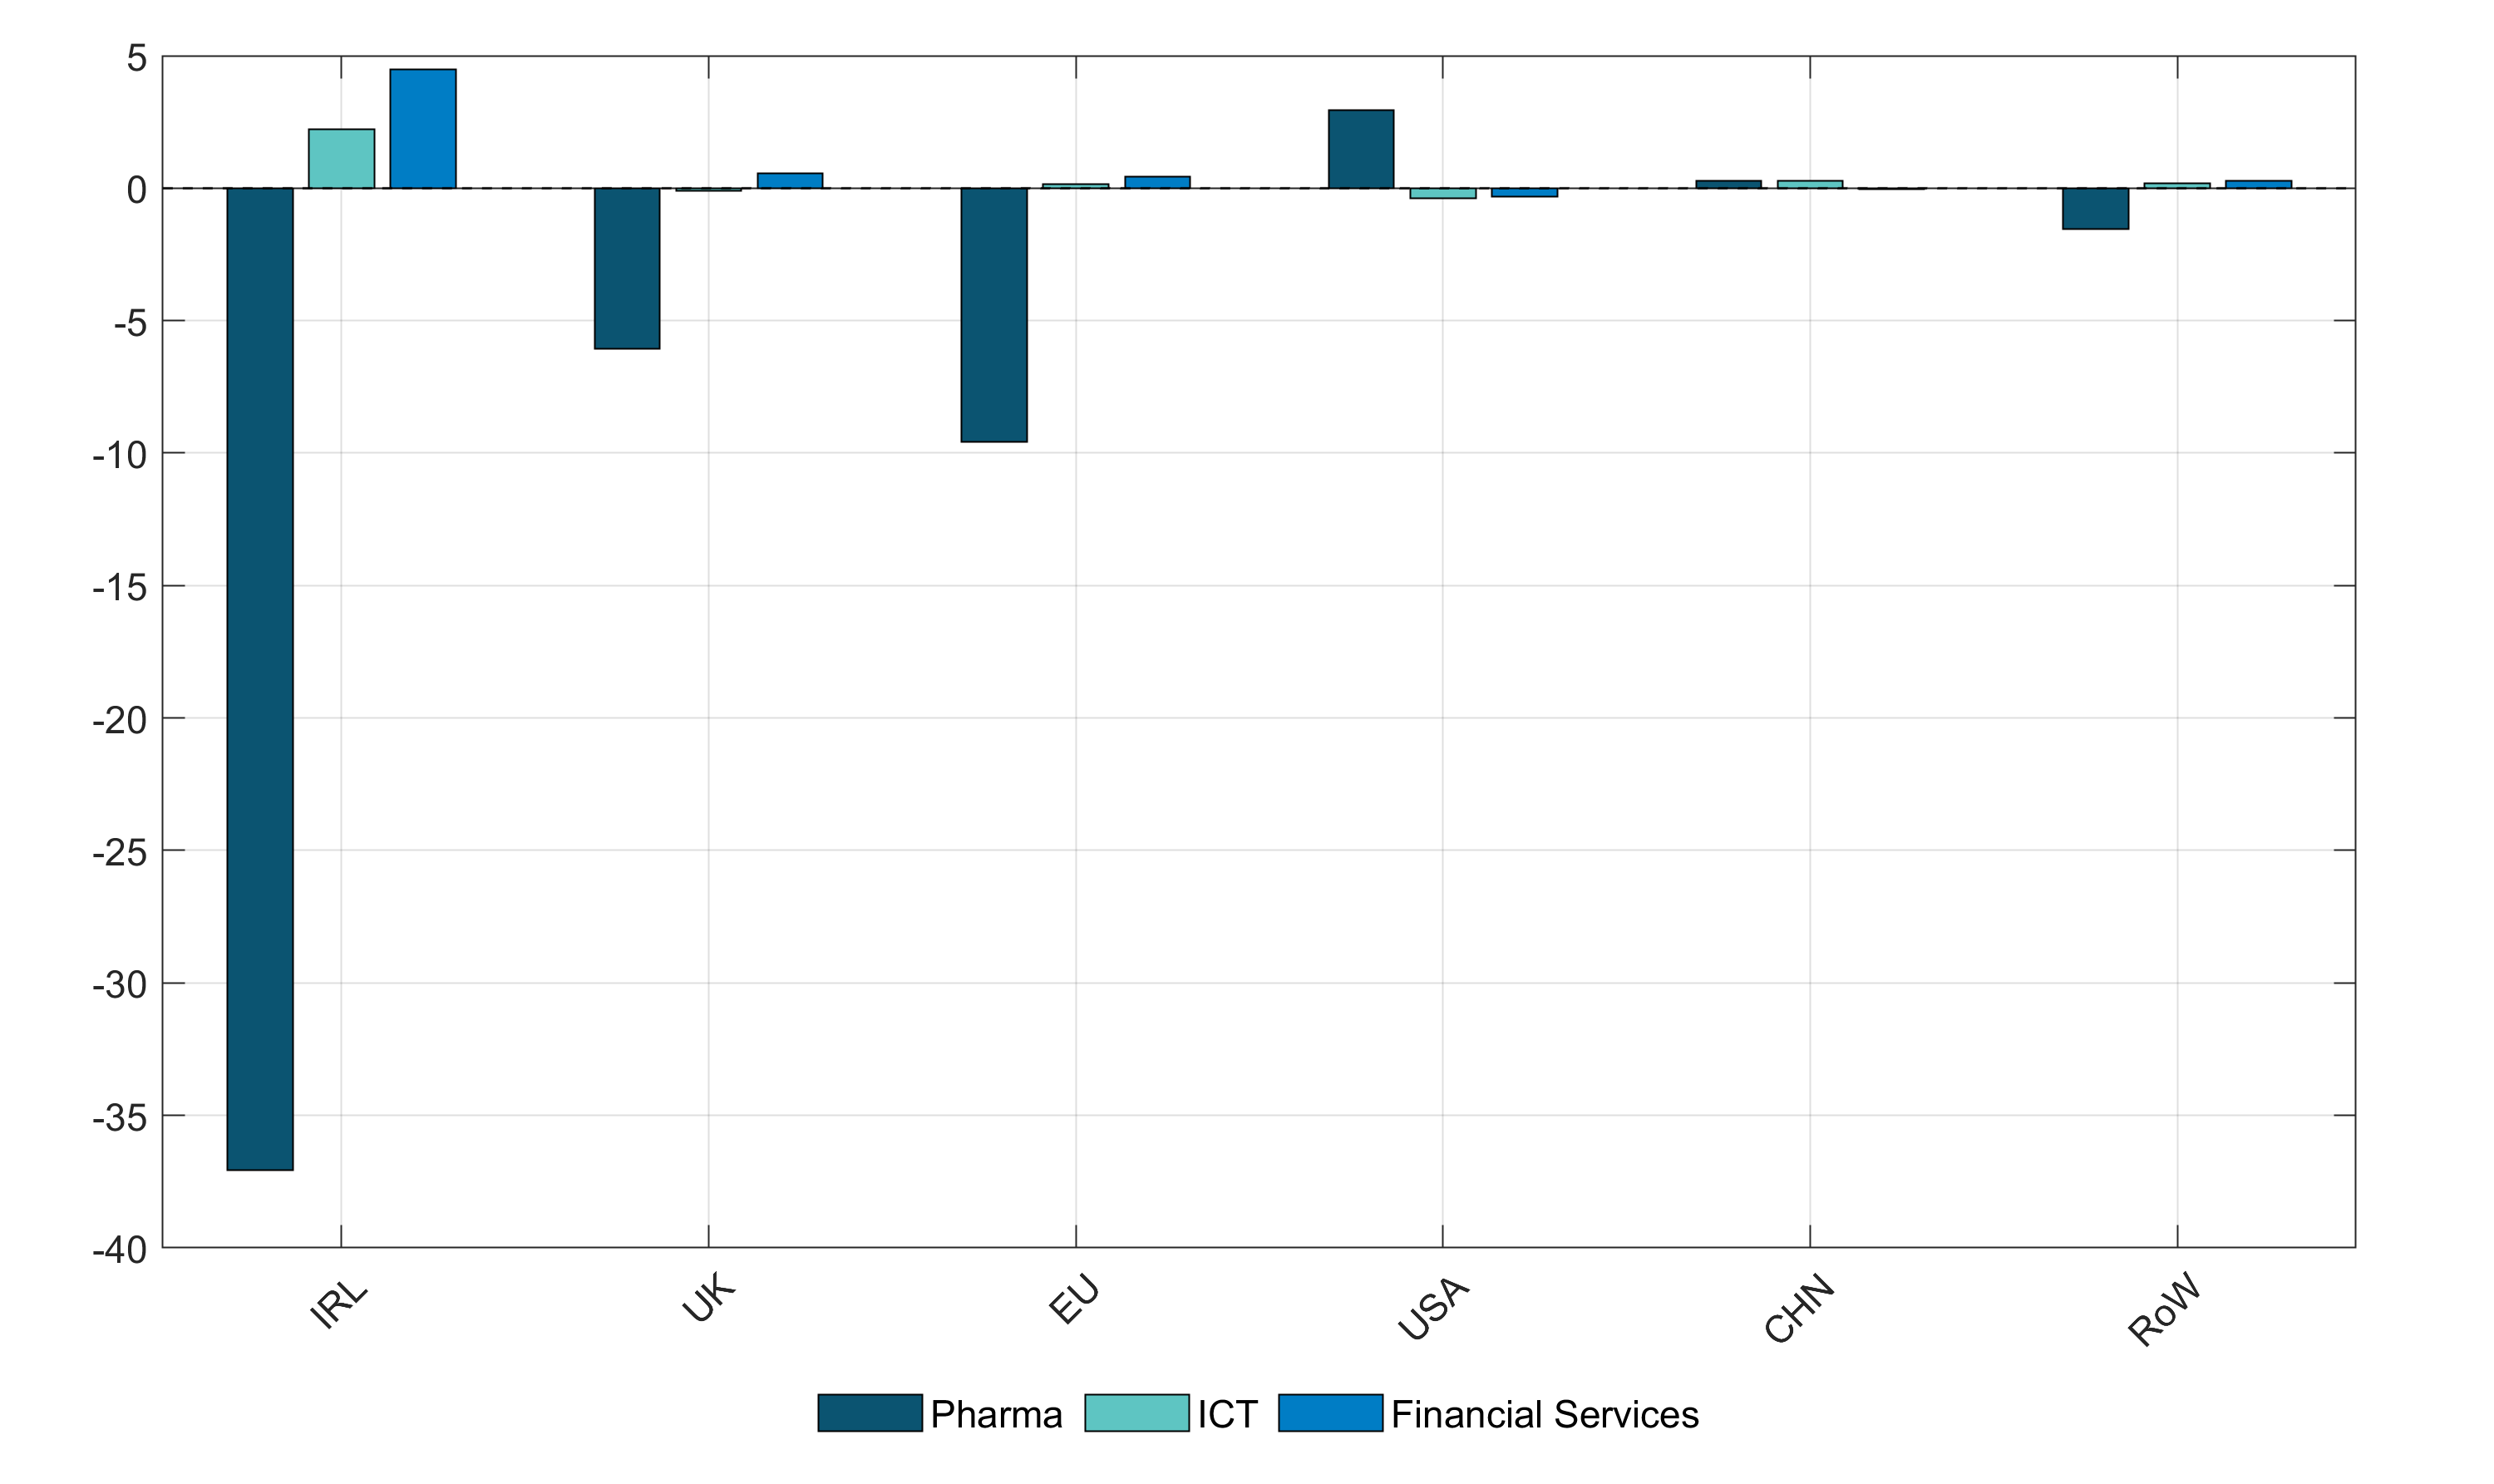
Source: Authors’ calculations using OECD ICIO data and the model from Baqaee and Farhi (2024).
Notes: his figure presents absolute changes in real value added across countries (Ireland, the UK, the EU excl. Ireland, the US, China and the RoW). The tariff scenarios are: blue represents the baseline scenario; red adds symmetric retaliation; yellow imposes baseline tariffs on all sectors; and purple includes an additional 50 per cent tariff on pharmaceuticals on top of the baseline. All values are expressed as percentage changes.
Accessibility: Get the data in accessible format. (CSV 0.27KB)
Endnotes
- Elizaveta Lukmanova, Research Collaboration Unit, contact [email protected], and Michael O’Grady, Irish Economics Analysis division, contact [email protected]. Thanks to Martin O’Brien, Fergal McCann, Thomas Conefrey, Cian Ruane and members of the Firms Working Group in the Central Bank of Ireland. All views expressed in this Insight are those of the authors alone and do not necessarily represent the views of Central Bank of Ireland
- Under the assumptions of our model, changes in welfare reflect changes in real household consumption, indicating an overall decline in the purchasing power of Irish households in response to the imposed tariffs. ↑
- Backward linkages represent the component of foreign value-added content embedded in domestic goods and services exports. Forwards linkage represent the domestic value-added exported to other countries and used as intermediate inputs in their goods and services exports ↑
- This is important, as tariffs modify the final demand of consumers in the country where they are imposed. The imposition of tariffs by a country that is the ultimate destination of exports directly affects the original exporting country’s production, trade flows and output, regardless of whether any direct trade between both countries occurs. ↑
- These trade shares have only increased since 2020. Pharmaceuticals accounted for 45.5 per cent of total Irish goods exports in 2024, while ICT services accounted for 57 per cent of total Irish services exports in 2023. ↑
- More broadly, the model captures key general-equilibrium channels—including price changes, demand spillovers, and factor reallocation—but abstracts from dynamic labour market frictions. ↑
- This assumption can be relaxed so that profits are rebated abroad. For Ireland, transferring a share of ICT-sector tax rebates to US households has only a limited effect on the results ↑
- We have also explored several alternative configurations—including sector-specific tariffs; a high-intensity trade war scenario with 130 per cent tariffs between the US and China and a 10 per cent US tariff on all other regions; and a global fragmentation scenario in which all blocs impose 25 per cent tariffs on one another. The main implications remain qualitatively robust. ↑
- The ’Repair and Installation of Machinery and Equipment’ sector - or ’Machinery install. & Repair’ - involves the specialised repair, maintenance, and installation of machinery and equipment produced by the manufacturing sector. Typical activities include maintaining and servicing industrial equipment, as well as installing large-scale machinery used in manufacturing and construction. Computers, semiconductors, and related products are instead included in the ’Computer and Electronic Equipment’ sector - or ’Computer & Electronics’ - which experiences no change in production levels after tariffs. ↑
- Global pharmaceutical production also falls, though the US records a small domestic increase of less than 1 per cent (Figure A.1 in the Appendix). This should be interpreted with caution, as immobile factors in the model may understate potential reallocations, while real-world frictions such as regulatory approvals and labour constraints would likely dampen them. ↑