Returning to Price Stability - Remarks by Deputy Governor Vasileios Madouros at the University of Limerick
09 February 2023
Speech

Good morning.
It is a real pleasure to join you here today at the University of Limerick1.
Today I want to focus on the outlook for inflation in Ireland.
As you know, inflation in Ireland in 2022, similar to many other countries around the world, reached its highest level in decades (Chart 1).
Naturally, over the past year, the rising cost of living has been at the top of most people’s concerns from an economic perspective.
Such a high rate of inflation has been a new reality for many people. In Ireland, approximately 80% of those in the labour force today have not experienced such high inflation rates in their adult life.
The surge in inflation has eroded living standards, dented economic confidence and led to a sharp deceleration in economic activity in the second half of last year.
While headline inflation is expected to ease this year, largely on the back of lower energy prices, underlying inflation is likely to be more persistent and more uncertain.
Central banks are at the forefront of the fight against inflation. In the euro area, the ECB has responded forcefully to ensure that inflation returns to its 2% target over the medium term.
So today, I want to both look back – to examine the causes of the surge in inflation – and look forward – to outline the key factors driving the outlook for underlying inflation in Ireland.
Chart 1: Inflation in Ireland in 2022 reached levels last since in the mid-1980s
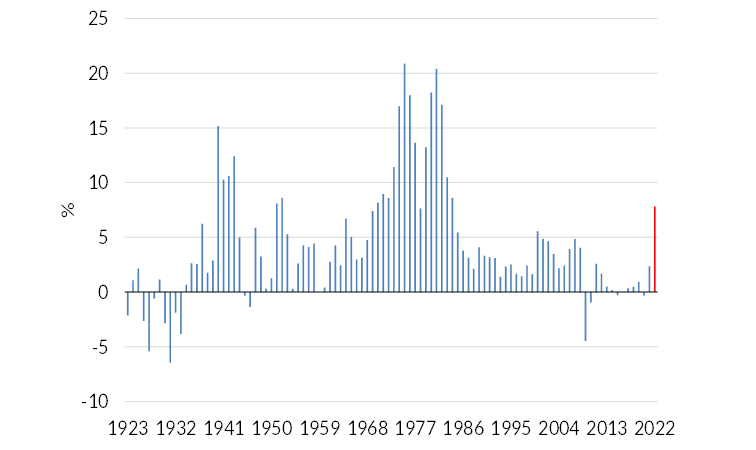
Source: CSO, Consumer Price Index (CPI)
The societal costs of inflation
But before I get to that, let me start by briefly outlining the societal costs of inflation.
A high and unstable rate of inflation is damaging for the economy as a whole.
When the rate of inflation is higher than the growth in nominal incomes – as it has been over the past year – households can purchase fewer goods and services out of their income.
On average, our standard of living has fallen.
But averages also mask important distributional effects.
Individual households’ typical consumption patterns differ, depending on their income, age, location or housing tenure.
Analysis by the Central Bank and the CSO has found that lower-income households or older households faced higher-than-average price increases recently2.
So, the impact of this surge in inflation has impacted most those with more limited means to absorb these price increases.
Of course, as I’ll cover a bit later, the acceleration of inflation has been partly triggered by a real shock: the impact of very high energy prices stemming from Russia’s invasion of Ukraine.
But that initial real shock can potentially lead to broader inflationary dynamics if companies and individuals seek to protect their real incomes – whether profits or pay – through compensating rises in domestic prices and wages.
Unfortunately, if that were to happen, and broader inflationary dynamics were to become engrained, everyone would be worse off. Because when the rate of inflation is high and unpredictable, it is more difficult for people to plan how much they can
spend, save or invest.
This harms the economy as a whole – not just now, but also into the future – through lower levels of investment, adversely affecting future economic potential.
It is these societal costs of a high and unstable rate of inflation that underpin the importance of bringing inflation back to target and ensuring inflation expectations remain anchored.
This is a lesson the global community learned the hard way in the 1970s and the 1980s.
Looking back: what drove the surge in inflation?
Before covering the outlook for inflation, let me start by examining the factors that have led to the surge in inflation we have experienced to date.
Ultimately, that was triggered by two major and over-lapping shocks hitting the global economy, including Ireland: the pandemic and Russia’s war against Ukraine and its people.
These shocks resulted in an imbalance between demand and supply across the economy, often starting in specific sectors, which have – in turn – resulted in accelerating price growth.
Pandemic shock
The initial pandemic shock led to a sharp contraction in economic activity, amid the introduction of necessary movement restrictions to protect public health.
Governments and central banks responded forcefully to protect households and businesses over this period, supporting economic activity and avoiding long-term scarring effects on the economy.
Following the initial stages of the pandemic, sectoral imbalances between demand and supply for certain goods began to emerge.
Economy-wide restrictions during the peak of the pandemic disrupted production and distribution of goods, leading to widespread supply bottlenecks at a global level (Chart 2).
These supply chain disruptions have been slow to dissipate. Even now, measures of global supply-chain pressures remain above pre-pandemic levels, although they have fallen markedly recently.
On the demand side, while health-related movement restrictions were still in place, there was a tilting of consumption away from services towards goods.
This pattern was particularly forceful in the United States, including in the context of very high fiscal support at the time.
But it was still relevant for us, given that – as a small open economy – we are exposed to the inflationary consequences of global developments.
And that pattern of tilting of consumption towards goods was also evident to some extent in Ireland, as suggested by some of our high frequency indicators on spending (Chart 3).
The combination of constraints on global supply chains and increasing demand for certain goods eventually fed through to higher consumer prices.
Fast-forward to the gradual re-opening of economies, and a sectoral imbalance between demand and supply in some service sectors also started to emerge, especially in leisure and hospitality.
The unleashing of pent-up demand coincided with both continued pandemic-related restrictions as well as emerging labour shortages in those service sectors, also pushing up prices (Chart 4).
Chart 2: Global supply chain pressures rose sharply during the pandemic and have been slow to dissipate
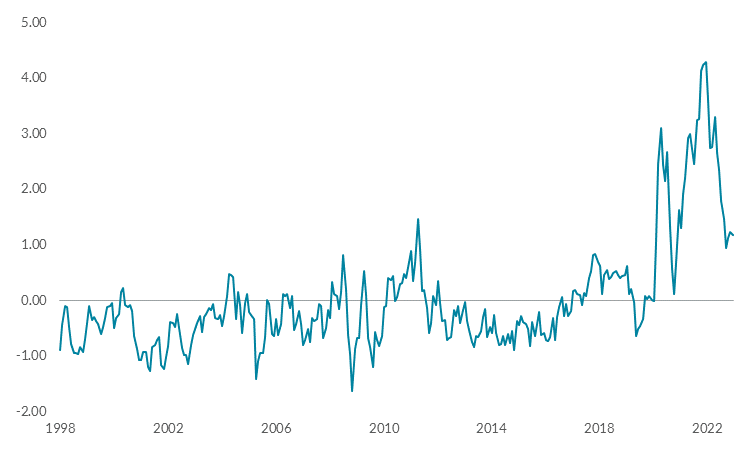
Source: NY FED - Global Supply Chain Pressure Index (GSCPI). Last obs: Dec. 2022
Chart 3: The pandemic led to an initial tilting in spending towards goods and away from services
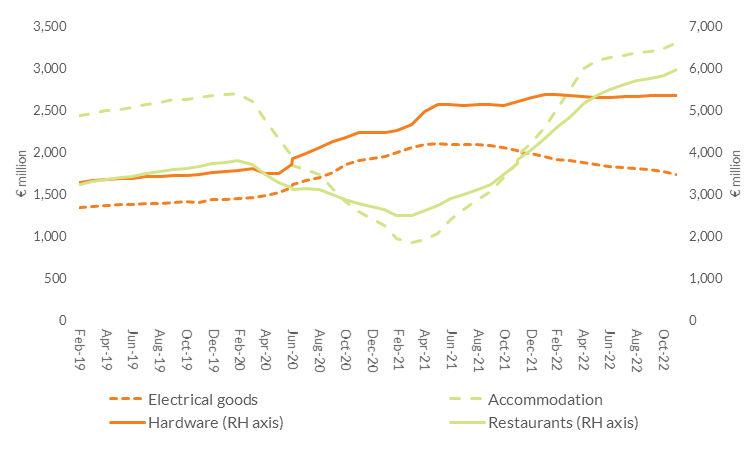
Source: Central Bank of Ireland. Lines show the rolling 12-month sum of spending under each category.
Chart 4: The re-opening saw a sharp increase in prices in pandemic-restricted services
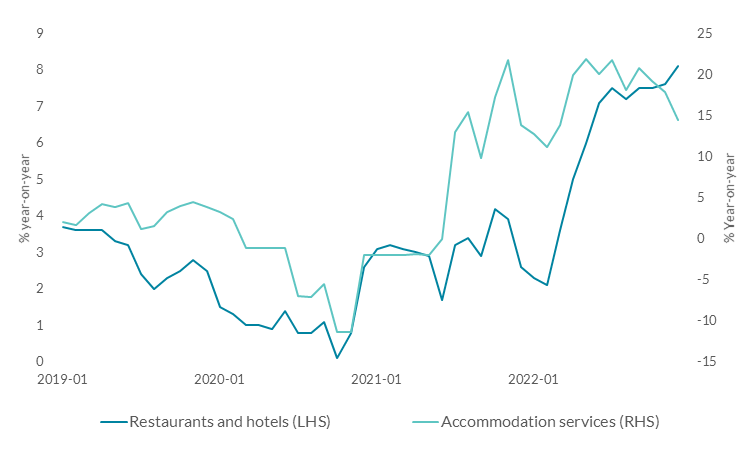
Source: CSO
Chart 5: Wholesale gas prices and latest market-implied path
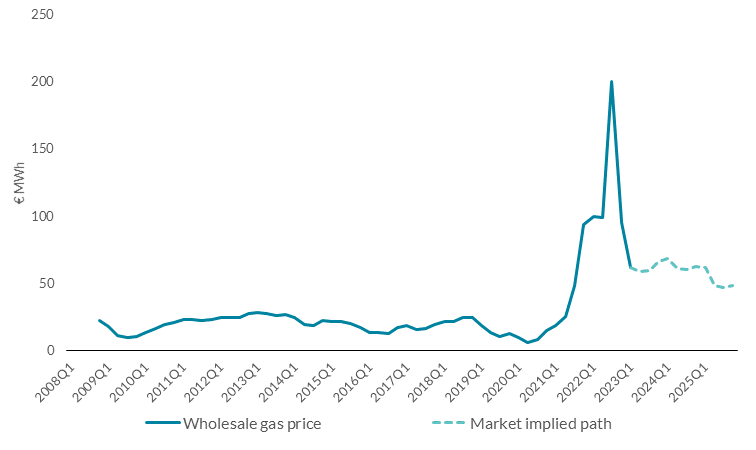
Source: Refinitiv Eikon
Overall, the strong rebound of demand following the pandemic amid persistent supply constraints initially drove inflation, which had already started rising in Ireland in 2021.
Russia’s invasion of Ukraine
But the shock became much more acute following Russia’s unprovoked war against Ukraine.
From an economic perspective, this had a particularly adverse effect on the price of energy (Chart 5).
In turn, that has had a particularly adverse economic effect on Europe, given its previous reliance on Russian energy.[3]
Energy prices have both a direct and indirect effect on prices people have to pay for goods and services.
The direct effects on home heating or electricity and personal transport fuels – driven by changes in energy prices in international energy markets – tend to pass through quickly to consumers.
Indirect effects occur via the impact on business costs (including the production of food) and tend to be passed on more slowly to consumers.
For Ireland, as a net importer of energy, the energy shock has resulted in an inescapable hit to our real incomes. This has manifested as a much larger increase in prices than incomes.
The effects of the energy shock resulted in a very sharp acceleration in headline inflation in 2022.
Underlying inflation
Ultimately, though, what is critical to understanding future inflation dynamics is the path of underlying – as opposed to headline – inflation.
Conceptually, this is the rate of inflation that would be expected to eventually prevail in the economy once temporary factors have dissipated.
This is a very difficult concept to measure in practice. But we monitor a number of metrics that can give us signals of trends in underlying inflation.
Chart 6: Headline, core and 'trimmed-mean' measures of inflation in Ireland
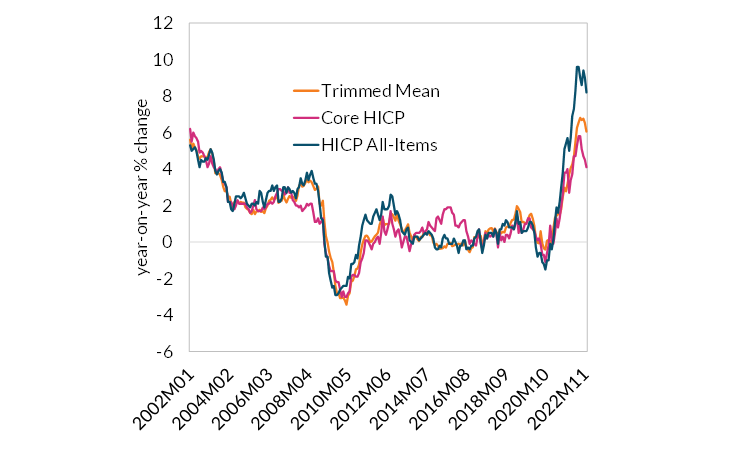
Source: Eurostat, CBI staff calculations. Last obs: December 2022.
Chart 7: Weighted share of price increases in the Irish HICP basket of goods and services
 Source: SDW, CBI staff calculations. Last obs: December 2022.
One metric is so-called core inflation, which permanently excludes certain volatile items, such as energy and food (Chart 6).
In Ireland, this metric increased from 2.8% in January 2022 to 5.8% in August 2022. It has subsequently fallen back somewhat to 4.2% in December, partly due to government interventions to reduce bus and rail fares and third level fees, but also due to
base effects and a return of more normal seasonal patterns in the price of some services like hotels and flights.
Another indicator is the so-called “trimmed mean” measure of inflation. This temporarily filters out certain volatile components, as they may be unrelated to broader macroeconomic developments.
Again, this points to a rapid acceleration in underlying inflation during 2022, with some moderation in latter stages of 2022, for the same reasons.
Finally, broader price pressures are also evident when we look at the share of the consumption basket where prices are growing at high rates.
Throughout the course of 2022, almost 60 per cent of the basket of goods and services was increasing at an inflation rate of over 5 per cent (Chart 7).
Across all these measures, the main message is similar. Price pressures have been broadening across the economy.
Rising energy prices have been directly impacting costs of production, and have been spilling over into broader, domestically-generated price pressures across the economy.
Inflation became broader and more persistent across the economy in 2022.
This is key, as it is these trends in underlying inflation that matter most for the medium-term inflation outlook.
The monetary policy response
Monetary policy is the primary policy tool for controlling inflation. It does so by influencing financing conditions across the economy and, through that, steering aggregate demand.
In the euro area, the Governing Council of the European Central Bank (ECB) sets monetary policy to achieve price stability.
The Governing Council consists of the ECB’s six executive board members and the twenty Governors of the national central banks that are part of the Eurosystem, including the Governor of the Central Bank of Ireland.
To achieve its price stability mandate for the euro area as a whole, the ECB targets an inflation rate of 2% over the medium term.
Given the growing inflationary dynamics observed in the euro area, the ECB – like most other central banks (Chart 8) – has responded with determination by raising interest rates to restore price stability.
To explain the monetary policy response, let me just go a bit further back in time.
Before the pandemic, the euro area had seen a prolonged period of below-target inflation. As a result, monetary policy had been set to support demand and push inflation towards its 2% target.
In the face of the inflationary shocks we have experienced recently, it became important to move away from this extremely accommodative monetary policy stance.
Chart 8: Monetary policy has tightened globally

Source: IMF - Adrian, Natalucci
Chart 9: Market-implied real interest rates for the euro area
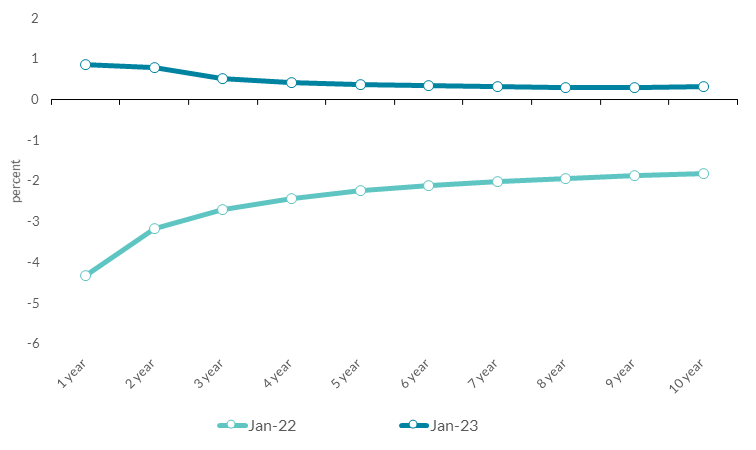
Source: Bloomberg, CBI staff calculation. Notes: Real rates are calculated as the difference between (nominal) swap rates and inflation swap rates.
Last year, the ECB promptly raised interest rates from their historically low levels towards levels that were no longer supportive of demand.
Indeed, market expectations for real interest rates shifted significantly upwards over the course of the year (Chart 9).
So far, the ECB has raised rates by a total of 300 bps since July 2022, and has signalled a further increase of 50 bps in March. It will then evaluate the subsequent path for monetary policy.
The Governing Council has been clear that it will stay the course in raising interest rates and in keeping them at levels that are sufficiently restrictive to ensure a timely return of inflation to the 2% medium-term target.
Keeping interest rates at restrictive levels will, over time, reduce inflation by dampening demand and will also guard against the risk of a persistent upward shift in inflation expectations.
The ECB’s Governing Council has also been clear that its future policy decisions will continue to be data-dependent and determined on a meeting-by-meeting basis.
This is important, as it allows the Governing Council time to assess macroeconomic developments as well as the transmission of its monetary policy, and take account of how interest rates are moving through financial markets to the real economy.
Looking ahead: what will drive inflation dynamics?
In that context, let me turn to the outlook for inflation.
The ECB’s latest forecast (December 2022) for the euro area indicates that headline inflation is expected to decline from an average of 8.1% in 2022 to 5.5% in 2023 and 2.3% in 2024.
The expected decline in headline inflation this year mainly reflects a sharp reduction in energy and food price inflation, as a result of negative base effects and an assumed decline in commodity prices, in line with futures prices.
Our own forecasts for Ireland from October point to a similar profile to the euro area, with inflation declining from 8.1% in 2022 to 6.3% and 2.8% in 2023 and 2024, respectively.
Since the publication of these October forecasts, the outlook for inflation has improved somewhat. Crucially, gas prices have moderated significantly over recent weeks, amid milder weather conditions and reduced demand for gas.
Our expectation remains that headline inflation peaked in Q4 of 2022 and should moderate as the year progresses, assuming no further unexpected shocks to energy prices.
This should provide some boost to consumer spending and overall economic activity as the year progresses. Our updated projections for economic activity and inflation will be published in early March.
Core inflation, however, is expected to be more persistent as the indirect effects of higher commodity prices continue to pass through from businesses to consumer prices.
More broadly, in the current macroeconomic environment, there is substantial uncertainty about these projections.
Indeed, as we have seen in the repeated upward revisions during 2022, when inflation is high, it tends to be both more unstable and more difficult to forecast.
So I’d like to focus on four key areas that are particularly central to the outlook for underlying inflation in Ireland.
Labour market dynamics
A key factor determining the outlook for underlying inflation over the next 18-24 months will be labour market dynamics.
An environment of broad-based price increases can affect price-setting and wage-setting behaviour, as firms seek to preserve profits and households seek to preserve real incomes.
Such dynamics could become more pronounced in the context of a cyclically-tight labour market.
And, as with many advanced economies in 2022, the labour market in Ireland has been exceptionally tight.
The unemployment rate is close to historic lows and the level of employment at a historic high in Ireland (Chart 10).
In recent months, there have been announcements of job cuts by large, international firms in the technology sector, many of which have a significant presence in Ireland.
This will be important to monitor going forward, not least given the unusually high footprint of the technology sector in Ireland.
Looking across the economy as a whole, however, vacancies have retained much of their post-pandemic high, with the vacancy rate around 50 per cent above pre-pandemic levels in Q3.
And most recent data suggest that job postings have remained at those high levels in Q4 and into January of this year (Chart 11).
What does this environment imply for wage dynamics?
The latest official data for 2022 Q3, point to annual growth in economy-wide earnings of around 3.5%, a broadly similar growth rate to the observed before the onset of the pandemic.
Private sector earnings grew at a rate of around 4.7% in 2022 Q3, somewhat above pre-pandemic growth of around 4%.
Within that aggregate, there is significant variation across sectors (Chart 12).
Chart 10: Employment in Ireland is at record highs
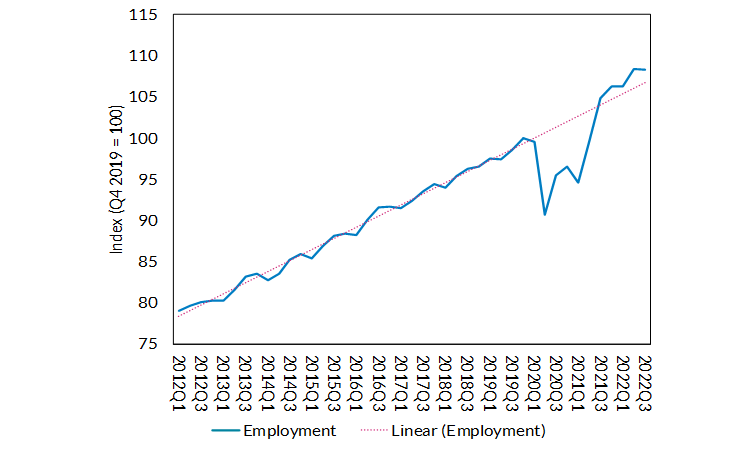
Source: CSO (LFS).
Chart 11: The number of job postings has remained elevated relative to pre-Covid
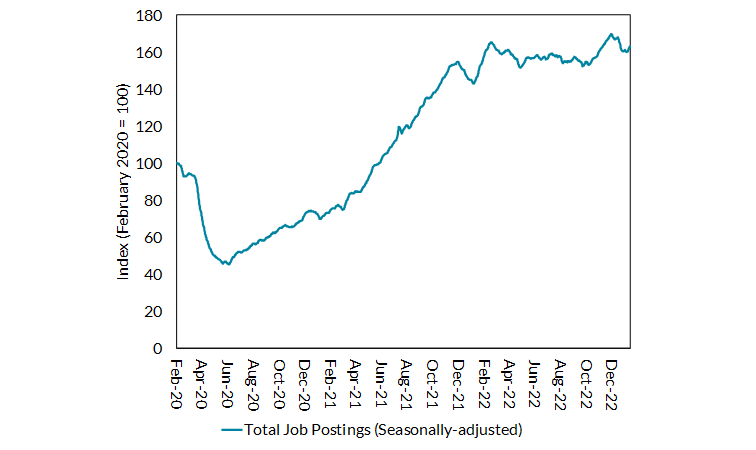
Source: Indeed.
And these aggregate statistics can be distorted by some of the compositional pandemic-related shifts in the labour market4.
An additional useful indicator we monitor to assess forward-looking wage dynamics is trends in posted wages in job ads by Indeed.
This points to a meaningful increase in posted wages growth over the past year (Chart 13).
Average annual growth in posted wages was 2.7 per cent in 2019, prior to the pandemic. This accelerated to a peak of 5.5 per cent in July 2022.
Most recently, it has slowed somewhat to around 4 per cent in December 2022, suggesting that employers may be taking stock of the weaker demand outlook.
Overall, these developments are consistent with strengthening second-round effects of the initial inflation shock.
Put differently, amid a tight labour market, inflation compensation seems to have been playing an increasing role in wage setting.
Some real wage catch up is expected of course. And, despite the broadening of wage pressures, the growth rates in wages is still below headline inflation.
Overall, at this point, we are not seeing wage developments that would point to a wage-price spiral emerging.
But these dynamics between wages, margins and prices will be core determinants of underlying inflation going forward.
While a period of real wage catch-up is to be expected, ultimately a return to price stability requires nominal wages growing in line with productivity growth and the 2% inflation target.
A sustained increase in real wage growth above productivity growth could be damaging for macroeconomic stability and competitiveness.
Should such a dynamic unfold, it would signal that inflation expectations were de-anchored, making it much more costly to return inflation to its target.
Chart 12: Nominal growth in hourly earnings by sector in Ireland (Q3 2022 v. Q3 2021)
.png?sfvrsn=2456991d_3)
Source: CSO (EHECS)
Chart 13: Growth in posted wages in Ireland, the US, and the EA
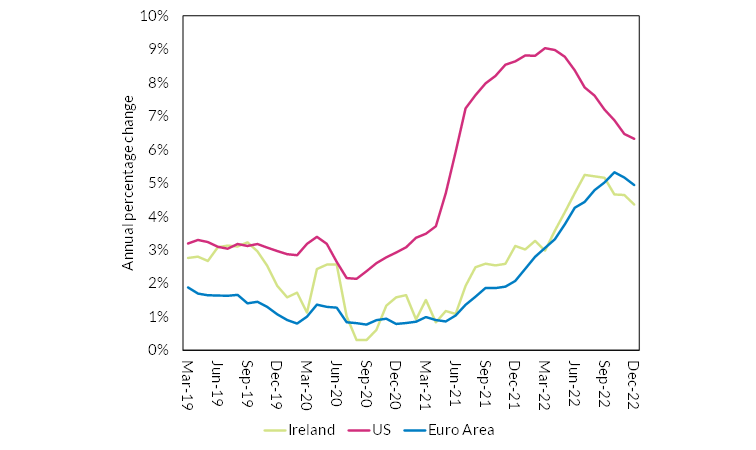
Source: Indeed.
The transmission mechanism of monetary policy
Rising interest rates take time to transmit through to the wider economy and affect inflation. This reflects the famous “long and variable lags” of monetary policy.
The economy is a complex ecosystem, with many economic actors taking decisions: financial institutions, households, companies and governments.
It takes time for changes in policy rates to feed through to the financing conditions facing businesses and households.
And, in turn, it takes time for changes in financing conditions to impact households’ and businesses’ own spending decisions, affecting aggregate demand.
Empirical evidence suggests that lags are typically between 5 and 12 quarters ( Lane, 2022;
Havranek and Rusnak, 2013).
This requires that monetary policy is set with a view to the future inflation outlook, not current inflation.
Understanding how long and how variable the lags will be during this period is more challenging due to the considerable changes in the economy and the financial system since the last major tightening cycle, more than 15 years ago.
Let me give you just some examples.
In the financial sector, the role of non-bank financial institutions has grown significantly over this time. And, since the last tightening cycle, there has been a raft of prudential reforms in the banking system, following the financial crisis.
In Ireland, there have also been significant changes in the mortgage market, with growing prevalence of fixed-rate mortgages.
More broadly, the global economy is now operating with higher levels of debt, which can affect the sensitivity of aggregate demand to tighter monetary policy. But the distribution of the debt has also shifted. For example, in Ireland private sector indebtedness
is much lower than during the last tightening cycle, whereas government indebtedness is higher.
The monetary policy toolkit has also evolved. Central banks have used unconventional policies such as forward guidance and asset purchases, with potential implications for the speed of the transmission mechanism ( Doh and Foerster, 2022).
So a key factor that will drive inflation dynamics this year and next will be the scale and speed of the transmission of interest rates across the economy.
Put simply, do changes in interest rates still affect inflation in the same way as they would have typically done in the past? Or has this relationship evolved?
It will take time to understand this fully. But we can look at some of the early indications.
Data on bank lending and deposit rates, for example, can inform us about how monetary policy is being transmitted via the banking system.
This is the early part of the transmission mechanism, and a necessary condition for feeding through to financing conditions facing businesses and households.
Looking at the euro area as a whole, when compared to the previous experience of rate hikes, simple metrics of pass through from policy to other interest rates appears broadly similar so far (Chart 14)5.
Chart 14: Cumulative change in new lending rates relative to cumulative change in policy rate
Source: SDW.
Chart 15: Interest rates on new mortgages over the past decade
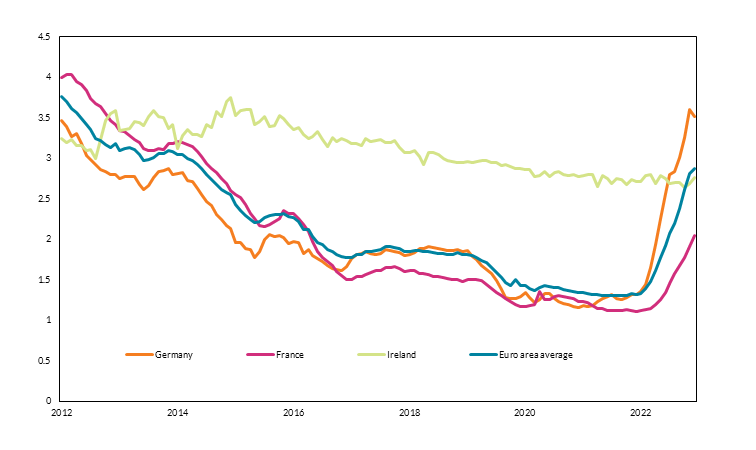
ource: SDW. Last obs: Dec. 2022.
In the Irish context, though, there have been some differences to date, which may result in different pass through dynamics relative to the rest of the euro area (Chart 15).
Breaking this down by sector, new lending and deposit rates for companies appear to have followed broadly similar paths to the rest of the euro area. But the same has not been the case for new lending to, and deposits from, households so far.
To some extent, this reflects time lags between approval and drawdown. And it also must be seen in the decade long context of mortgage rates falling by less than in other euro area countries over the period of very accommodative monetary policy (Chart
15).
But these are the dynamics we will monitor and analyse to understand the pass-through of monetary policy in Ireland.
Overall, we know that monetary policy is starting to work its way through the financial system, but it will take time to assess the impact it will have on economic activity and inflation, including in Ireland.
In the meantime, monetary policy can guide expectations of future inflation and thus influence price developments through this channel.
The ECB has emphasized its unwavering commitment to returning inflation to target, helping anchor inflation expectations.
Fiscal policy
The ECB's ability to bring down inflation in a timely manner also depends on fiscal policies pursued by governments across member states.
Tightening monetary policy is more effective at lowering inflation when it is coordinated with fiscal policy ( Kloostermans et al., 2022).
This is particularly relevant in a monetary union, as there may be circumstances in which the overall monetary stance may not be fully aligned to the economic conditions in every country.
In these situations, domestic fiscal policy becomes even more important for ensuring domestic economic stability.
At a headline level, the public finances in Ireland improved markedly last year.
The Exchequer ran a surplus of €5bn (an estimated 1.9 per cent of GNI*) in 2022 compared to a deficit of €7.4bn deficit (-3.2 per cent of GNI*) in 2021.
Of course, much of this headline strength in the public finances in recent years has been driven by exceptional growth in corporation tax.
Corporation tax now accounts for more than one euro in every four of Exchequer tax revenue and is the State’s second largest tax revenue source.
As noted by the Department of Finance, if estimated excess corporation tax is excluded, the public finances would remain in deficit in 2022 compared to the headline Exchequer surplus of €5 billion.
The sustainability of corporation tax receipts over the long term is highly uncertain and dependent on the activities of a small number of foreign-owned firms.
In 2021, firms in the ICT sector paid €3.3 billion (or 21 per cent) of all corporation tax.
Although the implications of the current challenges in the ICT sector for corporation tax revenue are unclear, recent developments are a reminder of the structural sensitivity of the Irish economy and public finances to firm or sector specific shocks.
Important trade-offs also remain in managing the public finances in the current context of the high inflation environment.
Significant fiscal policy intervention has been introduced to mitigate the near-term impact of the sharp increase in the cost of living, most recently in Budget 2023.
Fiscal support has been necessary to protect those most vulnerable in our society from the energy price shock.
As I mentioned earlier, low-income households have faced significantly higher effective inflation rates than higher-income households. And they also have more limited financial buffers to absorb this shock.
In light of these distributional effects, fiscal policy is the right tool to cushion the impact of the shock on the most vulnerable households and businesses.
From the perspective of macroeconomic management, it is important that fiscal supports are targeted, temporary and tailored to preserving incentives to consume less energy.
That ensures that the measures support those most vulnerable, without contributing to broader inflationary pressures or creating vulnerabilities in the public finances.
Of course, there is a risk that the level of some international energy prices could remain persistently elevated relative to historical norms.
That would create more difficult challenges and focus would need to shift to enabling households and businesses to adjust their energy consumption patterns.
Such an adjustment would also contribute positively to the broader, necessary, transition to net zero.
Overall, in the current conjuncture, it is important that choices around the overall balance between tax and expenditure avoid adding to macro-economic stimulus and, through that, medium-term inflationary pressures.
Persistent supply side effects of shocks
Let me turn to the final factor that I wanted to highlight: potential persistent effects on the supply side of the economy.
The economy has experienced two major negative economic shocks in quick succession in the form of the global pandemic and the war in Ukraine.
Beyond their near-term, cyclical effects, shocks of this magnitude can also have a more persistent effect on the economy’s potential output.
One channel is through the impact of the pandemic on the labour market. In some countries, the pandemic has led to a decline in labour force participation. If this persists, this could lead to a decline in their trend rate of output growth.
The performance of the labour market in Ireland has been more positive. Indeed, overall labour force participation is now higher than prior to the pandemic and this seems to be partly a structural trend ( Arrigoni, Boyd and McIndoe-Calder, 2022 (PDF 676.87KB)).
A second channel is through the potential that these shocks on investment and the capital stock. High energy prices, for example, are likely to reduce investment as well as the value of the existing capital stock, especially in the most energy-intensive
sectors.
One very specific manifestation of this channel is housing investment. This was necessarily lower than it would otherwise have been because of pandemic-related restrictions. And the recent sharp increases in input costs in the construction sector have
also been weighing on housing commencements. With housing being a core challenge for the Irish economy, this could also affect the future capacity of the economy.
A final channel is via potential changes of these shocks on productivity. In light of both the experience with the pandemic and global geopolitical tensions, companies might consider altering their locations of production or their transport routes.
This potential shift from efficiency to resilience in supply chains could lead to lower productivity growth.
It will, of course, take time to understand these effects fully. But recent shocks have shown the importance of focusing on the supply-side of the economy.
Conclusion
Inflation soared to multi-decade highs last year.
It is likely that headline inflation has now peaked and – in the absence of further energy price shocks – we expect it to moderate this year and next.
But underlying inflationary pressures in the economy have built and will be more persistent.
And it is those underlying inflationary pressures that are particularly crucial for the medium-term outlook.
The ECB has been clear that it will stay the course in raising interest rates and keeping them at sufficiently restrictive levels to ensure inflation in the euro area returns to the 2% target.
Fiscal policy also has an important role to play, by managing the difficult balancing act of supporting those most vulnerable, without adding to inflationary pressures.
Ultimately, bringing inflation back to the 2% target over the medium term matters for everyone, as a high and unpredictable rate of inflation entails large costs for society.
Notes
1 I am very grateful to Rob Kelly, Thomas Conefrey, Gillian Phelan, Zivile Zekaite, Sorcha Foster, Neil Lawton, Aurelio Nocera, John Scally, Ronan Hickey, Enda Keenan, Tara McIndoe-Calder, and Graeme Walsh for their assistance and advice in preparing
this talk.
4 CSO earnings data grew strongly at the onset of the pandemic as a greater amount of relatively lower-earning workers transitioned from employment to inactivity, particularly in contact-intensive economic sectors, resulting in a higher
employment composition of higher-earning workers when compiling growth rates. This trend has slowed in recent quarters as employment levels have increased with greater numbers transitioning from inactivity to part-time and contact-intensive
roles to lower average earnings levels. See CSO Labour Market Insight Bulletin Series for further
information.
5 However, the current interest rate hiking period is being carried out in the context of a larger ECB balance sheet accumulated during various asset purchase programmes. These asset purchases would also have implications for the monetary
policy stance.