Robert Kelly, Chief Economist, Central Bank of Ireland
What is the outlook for the Irish economy?
The Irish economy has demonstrated resilience, maintaining robust growth even as geopolitical shocks have driven up energy prices. But there remains a significant risk of higher inflation.
Investment in business equipment continues to provide strong support for growth – concentrated in AI and data centre activity, and accounting for more than 40 per cent of domestic growth so far this year.
Despite higher inflation, consumer spending has remained remarkably resilient, and recent data points to greater savings buffers supporting a stronger consumption outlook.
Overall, we see a modest increase in the outlook for domestic activity, with average growth of 3.5 per cent annually out to 2028.
What are the projections for housing supply?
We expect significant growth in housing output over the coming years, increasing by almost a quarter from last year to 45,000 units in 2028.
However, we have revised our forecasts down slightly, based on recent data that shows a significant increase in planning to completion times. Delivery times for new dwellings have doubled from two to four years since 2017.
Our forecasts depend on the delivery of the Accelerating Infrastructure Action Plan and support for productivity improvements to address capacity constraints in the construction sector.
These are key to reversing the trend of slower delivery and meeting housing demand in our fast-growing economy.
Comment
Pronounced structural changes continue to exert an influence on the global economy and Ireland, intersecting with regular business cycle conditions. Trade tensions remain high and firms are adjusting to a fragmented and less favourable trading environment than existed for much of the recent past. Added to this – and reflective of a more volatile geopolitical environment – the Iran-US war led to a renewed surge in global energy prices, reigniting pressures that had only recently subsided following Russia’s invasion of Ukraine. Across Europe, the summer period saw record temperatures and prolonged drought, occurrences made far more likely as a result of the effects of climate change. This has placed strain on food production and transportation, adding a further impetus to already high inflation. Closer to home, the labour market is experiencing structural shifts, including adoption of new technologies, continued ageing of the population and the increasingly important role of net inward migration – already accounting for around two-thirds of employment growth. In the face of these significant structural forces, the economy has displayed impressive resilience to date, but careful policy choices and long-term planning will be needed to sustain steady economic growth and low unemployment, reduce inflation and improve the underlying health of the public finances.
Annual National Accounts data published by the CSO in July confirm the economy’s continued rapid growth in the post-pandemic period. The economy, as measured by real modified Gross National Income (GNI*), grew by 4.7 per cent last year. Since 2021, annual average growth in real GNI* of 5.5 per cent per annum has been recorded, well above the economy’s estimated potential growth rate. The rapid pace of growth means that the overall size of the economy – based on GNI* in real terms – increased by 35 per cent or €89 billion between 2019 and 2025. The growth in the economy has delivered employment growth, higher incomes and increased government revenue. New analysis published in this Bulletin confirms the increasing importance of the multinational sector to Ireland’s economic performance as measured by GNI* (Box A). Although labour and other income derived from domestic sources accounts for the majority of real GNI*, the contribution of MNEs (including MNE corporation tax, wages and other related income) has increased substantially over time – from 16 per cent in 2013 to 26 per cent in 2025.
The most recent data confirm that the positive momentum in economic activity from 2025 has carried over into the first half of 2026, but with significant differences in the pace of activity occurring across different parts of the economy. Even with higher inflation, consumer spending continues to grow steadily. MNE-related investment is providing a significant stimulus to overall modified domestic demand (MDD). The profile of the latter is uneven in the quarterly data but a clear underlying trend is evident with the level of machinery and equipment investment having risen in real terms by over one third in just three years. Substantial increases in spending on AI-related and data-centre hardware by multinational firms in Ireland is underpinning the growth in this component of investment, which has a large import share. These imports are included in MDD which is currently at the upper end of the range of estimates of domestic growth at just over 3 per cent in the first half of 2026. Other measures, such as output of the domestically-dominated sectors, show a slower pace of growth currently of around 2 per cent.
Looking ahead, this pattern seems likely to hold over the forecast years with MDD expected to grow at a slightly higher annual average rate of 3.5 per cent, compared to growth in GNI* of 3.1 per cent – the latter being close to the economy’s estimated long-run potential. Assuming inflation moderates to close to 2 per cent by 2028 in line with the forecasts in this Bulletin, steady growth in consumer spending will be supported by modest real income gains from 2027 and the buffer provided by the high level of household savings. Inflation forecasts are broadly unchanged from the previous Bulletin (June) but uncertainty around these baseline projections is exceptionally high with risks broadly balanced for growth and to the upside for inflation.
Along with increases in consumer spending, overall MDD is expected to be supported by a rise in investment out to 2028. While overall modified investment has been revised up in this Bulletin, the picture is somewhat mixed. The rise in demand for software and equipment linked to the growth in AI should support increases in MNE-led investment in the coming years. There is the potential for stronger growth in this component over the short term beyond the baseline projections, should global demand remain high. In relation to housing output, there has been a welcome rise in residential construction activity with housing completions more than doubling between 2017 and 2025. Further increases in housing output are expected out to 2028 but this rests on achieving progress across several dimensions that influence the delivery of housing. Signals from housing commencements continue to be difficult to interpret, given the policy-induced surge in 2024. This has been followed by a fall in commencements in 2025 and 2026, while annual planning permissions have remained broadly stable in the mid-30,000s. Moreover, analysis in this Bulletin shows that for a given pipeline of housing activity currently (already approved or commenced dwellings), the average duration from the initial lodgement of planning application to completion is four years, twice as long as a decade ago (Box B). These considerations weigh on the overall outlook for housing completions and emphasise the importance of timely implementation of reforms to speed up the delivery of key national infrastructure, including those in the Accelerating Infrastructure and Action Plan. These reforms, if actioned in an effective and timely manner and combined with measures to increase productivity, should facilitate the delivery of increased housing supply outlined in our central forecast.
Beyond housing, recent data illustrate the gap between the growth in the economy, employment and the population and the State’s infrastructure more broadly. The population increased by just under 67,000 to an estimated 5.52 million in the year to April 2026. With the natural increase in the population slowing, net inward migration accounted for almost three-quarters of the increase in the overall population and is playing an increasingly important role in boosting labour supply and employment, with much of the latter in high skilled occupations. Although employment growth is forecast to slow out to 2028, migration will remain a critical structural component for increasing labour supply, absorbing macroeconomic shocks and sustaining economic growth.
Higher energy prices have added significantly to headline inflation in 2026 as the Iran-US war has pushed up international energy prices. Along with these externally determined price pressures, services inflation remains elevated. This partly reflects the pass-through of higher input costs but also continued domestic demand and wage pressures. The key risk is the potential for second-round effects to emerge, whereby workers seek compensation for real wage erosion through higher nominal wage demands, and firms pass these higher labour costs through to consumer prices so as to maintain profit margins. While there is no evidence of widespread second-round effects occurring to date, these would take longer to emerge and the risk remains significant, particularly if the energy shock proves more persistent or if the conflict escalates further.
At the euro area level, monetary policy has responded to heightened inflationary pressures to ensure euro area inflation stabilises sustainably at the 2 per cent medium-term target. On 10 September, the Governing Council raised the three key ECB interest rates by 25 basis points, following a similar increase in June 2026. The conflict in the Middle East continues to generate inflation pressures, and inflation is set to remain well above target for an extended period. The Governing Council’s deliberations remain data-dependent, with the Council continuing to assess incoming information on a meeting-by-meeting basis. In particular, the Governing Council’s interest rate decisions will be based on its assessment of the inflation outlook, the risks surrounding it and the strength of monetary policy transmission.
For a small open economy such as Ireland, fiscal policy has a key role to play in delivering sustainable economic growth and low inflation over the medium term. To achieve this, the fiscal stance should be countercyclical, i.e. it should support the economy when it is operating below its sustainable potential (i.e. when unemployment is high) and conversely, it should reduce demand when the economy is operating above its sustainable potential and excessive inflationary risks are present. Current and projected economic and labour market conditions indicate that the economy does not require additional budgetary stimulus at present. A benefit of pursuing a countercyclical policy stance in the present economic conditions is that larger fiscal buffers could be accumulated, which could then be deployed when a downturn in economic activity occurs and unemployment rises.
With inflation already above 3 per cent and with the balance of risks to the central forecast to the upside, pursuing a countercyclical budgetary stance would also guard against further aggravating price pressures in the economy. In addition to substantial budget day allocations, expenditure overruns (relative to initial Government plans) have been commonplace in recent years, providing additional stimulus to the economy. As analysis shows, continued spending overruns in line with post-2021 growth rates would add approximately 1 per cent to the price level by decade's end.
The unchanged spending ceilings in the Summer Economic Statement (compared to the April 2026 Annual Progress Report) should be preserved for Budget 2027 to limit fiscal exposure to potentially transitory corporation tax receipts, concentrated among a small number of multinational firms.
Maximising the delivery of new public infrastructure to address known deficits in key national infrastructure and crowd in higher private investment will boost the economy’s long-run growth potential. Investment targeted at accelerating the decarbonisation of the economy would help reduce exposure to volatile imported fossil fuel prices (including as a result of geopolitical shocks) and support a more stable cost of energy for Irish households and businesses. These actions would also contribute to achieving emission reduction targets, that are at present being missed.
This would mark a more sustainable response to the current high inflation environment than largely untargeted excise cuts on fuels which affect price signals and risk an unwanted further narrowing of the tax base. For households particularly exposed to the effects of higher energy prices, temporary and targeted measures can protect the most vulnerable while still ensuring that the overall budgetary stance builds resilience in the public finances.
Outlook for the Irish Economy
Recent Developments and Forecast Summary
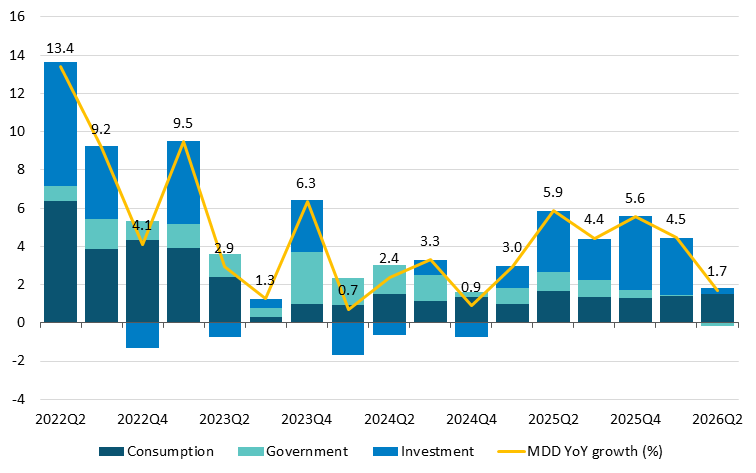
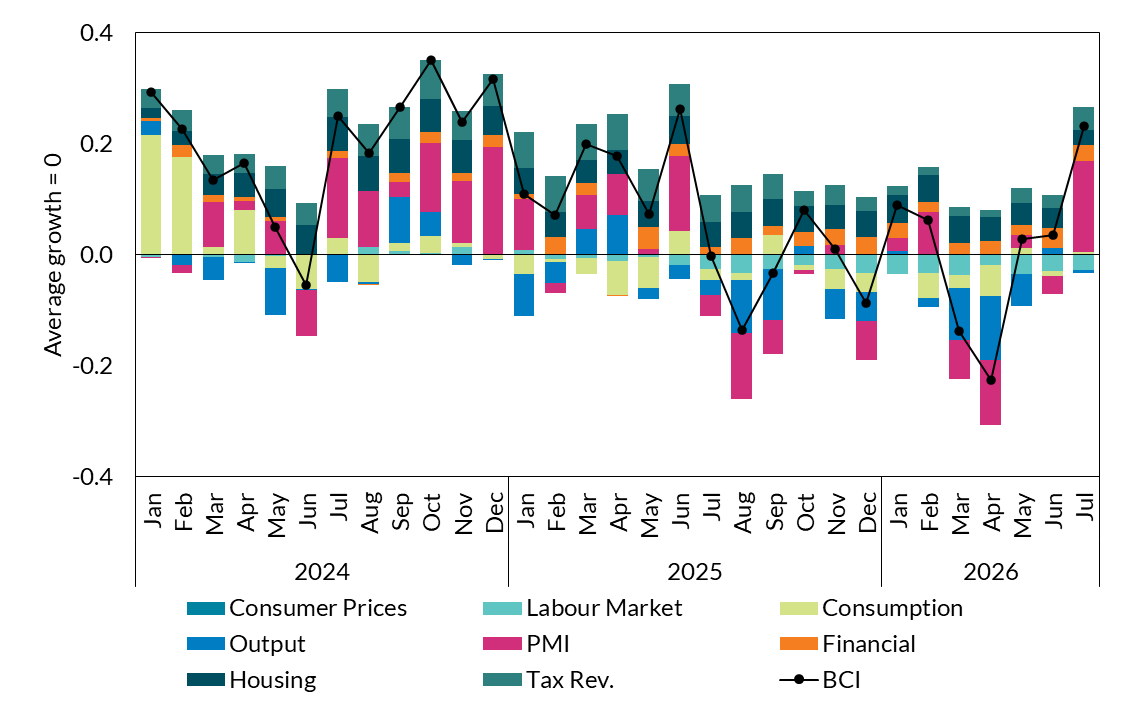
Economic activity (Modified Domestic Demand - MDD) expanded by 1.7 per cent year-on-year in Q2 2026, down from 4.5 per cent in Q1 (Figure 1). Modified investment increased by 1.4 per cent year-on-year, with multinational-dominated modified machinery and equipment up 24 per cent, reflecting substantial AI-related and data-centre hardware investment. This marks a continuation of a trend evident since 2023 when this activity began to rise sharply. Domestic building and construction investment contracted by 6.9 per cent year-on-year in Q2 2026, driven by weakness in non-residential building and construction. Consumption expanded by 2.9 per cent year-on-year, carrying more momentum into 2026 than forecast in the previous Bulletin. Other domestically-oriented indicators of activity also point to growth in Q2. Non-corporation tax revenue was robust in the first eight months of the year, with income tax and VAT receipts showing strong increases, while output of domestically-oriented sectors increased by 1.8 per cent year on year in Q2. The Central Bank's Business Cycle Indicator (BCI) summarises the information from the latest high-frequency monthly data, separating out the underlying trend in activity from movements due to noise. The BCI suggests that the domestic economy is growing at around its long-run average rate after recovering from a notable weakening in March and April (Figure 2). The uptick in July is broad-based with only labour market data contributing slightly negatively.
MDD growth moderated in Q2 as investment weakened, while consumption continued to expand
Figure 1: Contributions to year-on-year change in Modified Domestic Demand (MDD), (p.p.)
Source: CSO. Chart data in accessible format. (XLSX 176.07KB)
The BCI remains around its long-run average, after recovering from a slowdown in March and April
Figure 2: Business Cycle Indicator and contributions, average growth = 0
Source: Central Bank of Ireland. Chart data in accessible format (XLSX 176.07KB).
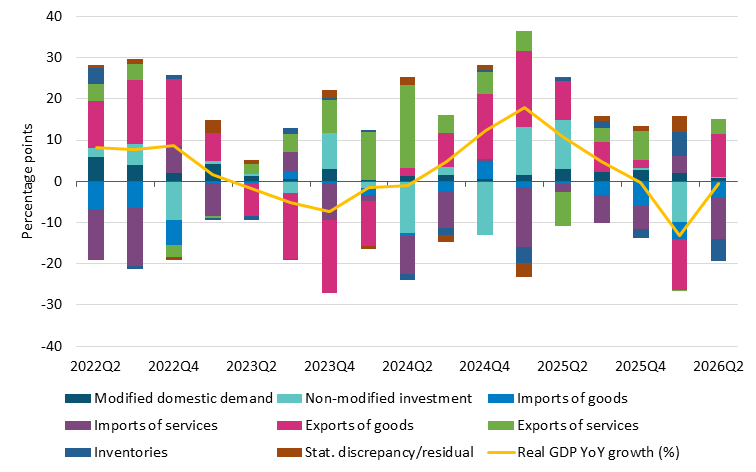
GDP rebounded with 10.2 per cent quarter-on-quarter growth in Q2 2026 following a contraction of 7.8 per cent in Q1. Following a 9.5 per cent decline in Q1, overall exports increased by 17.1 per cent, with goods exports increasing by 39.3 per cent and services exports by 3.4 per cent. Imports grew by 4 per cent, led by AI-related goods and service royalties and licenses largely paid to foreign multinationals. The first half of this year saw GDP decline by 7 per cent compared with the corresponding period last year, with exports broadly unchanged and imports 6.5 per cent higher. The Q2 recovery in GDP, therefore, reflects substantial volatility in multinational activity occurring alongside a more moderate expansion in the domestic economy (Figure 3).
GDP rebounded in Q2 as goods exports recovered from their first quarter decline
Figure 3: Contributions to year-on-year change in Gross Domestic Product (GDP), (p.p.)
Source: CSO. Chart data in accessible format (XLSX 176.07KB).
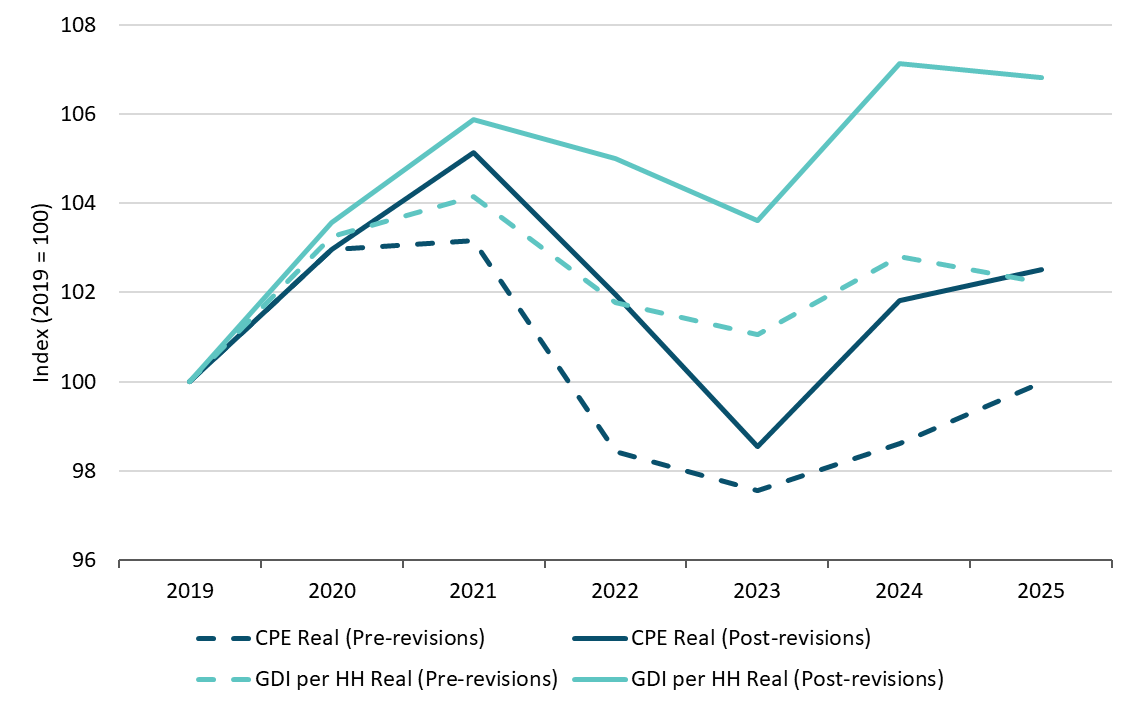
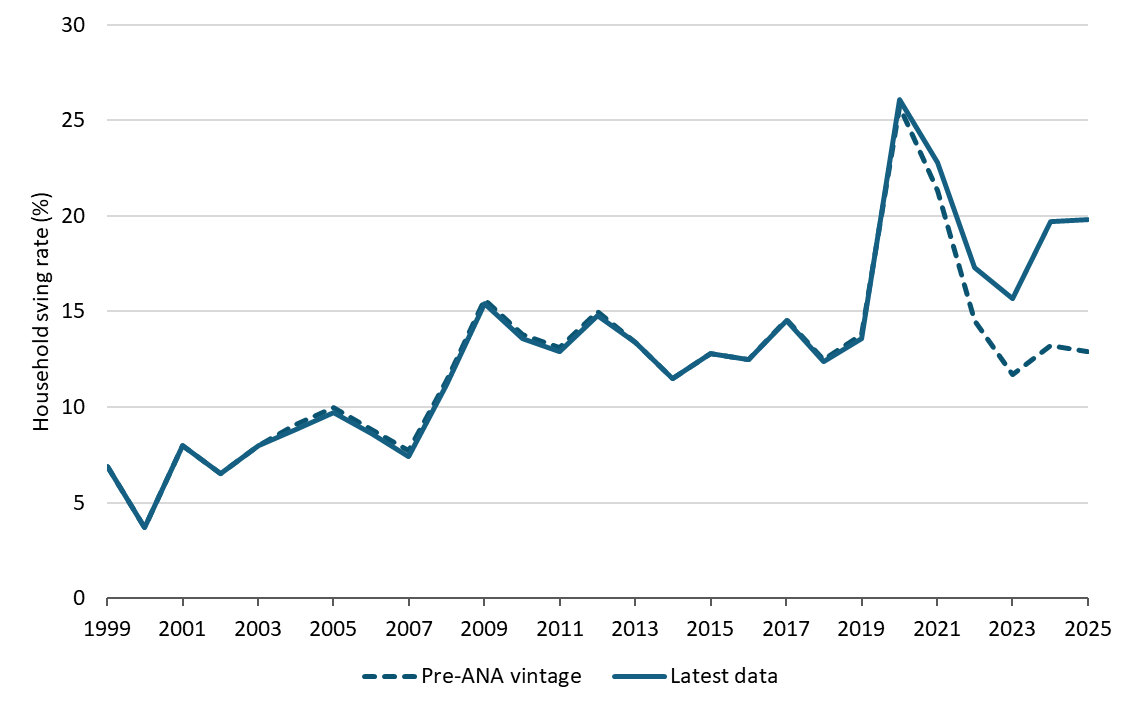
Annual National Accounts revisions released in July show that wages recovered to their pre-pandemic level earlier than reported in previous data, with households saving a considerably higher share of income. Revisions to Compensation of Employees in the Annual National Accounts resulted in significant upward adjustments to nominal wages backdated to 2021, with consumption revised down. Overall, average real compensation per employee for 2025 has been revised up from equalling pre-pandemic (2019) levels in the initial data to now being 2.5 per cent above (Figure 4). Similarly, real gross disposable income per household has been revised upwards across several years with data for 2025 now 6.4 per cent higher than before the revision and 6.8 per cent higher than in 2019. An important implication is that the wage catch-up which followed the inflationary surge of 2022 occurred earlier than indicated in previous data. The combination of an upward revision to household incomes and a downward revision to consumption means that the implied household savings ratio rose sharply for the period 2023-25 in the revised data. For 2025, the ratio was revised up from 12.9 per cent to 19.9 per cent (Figure 5), putting the Irish households' savings rate at the top of the euro area (Figure 13).
Upward revisions to wage growth outturns have seen real wage growth and disposable income exceed pre-pandemic levels
Figure 4: Indexed growth of real compensation per employee and gross disposable income per household
Source: CSO. Chart data in accessible format (XLSX 176.07KB).
Revised data show a significantly higher household savings rate back to 2020
Figure 5: Household savings rate (%) pre and post 2025 Annual National Accounts (ANA)
Source: CSO. Chart data in accessible format (XLSX 176.07KB).
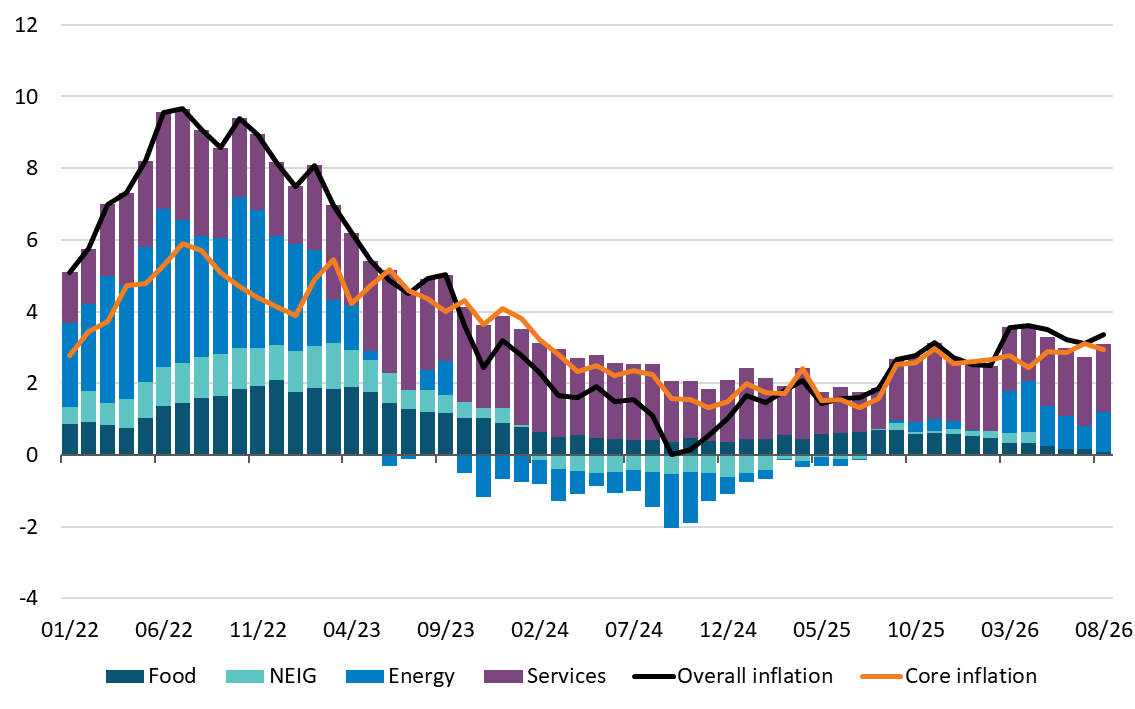
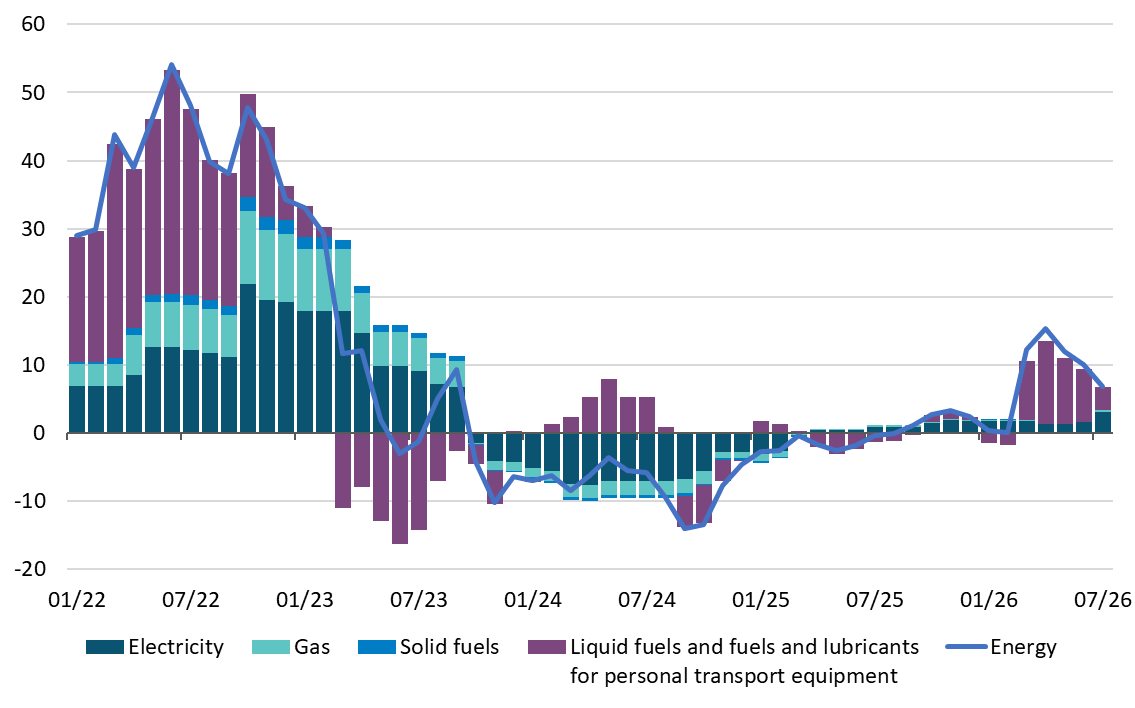
According to flash estimates, headline HICP inflation reached 3.4 per cent in August 2026, with services remaining a persistent source of price pressures while energy contributions have moderated. In July's full release, headline HICP inflation was 3.1 per cent year-on-year, with core inflation remaining stable at 3.2 per cent (Figure 6). The composition of inflationary pressures has continued to shift, with the contribution of energy to headline inflation roughly halving between April and July, before picking up again in August. While liquid fuel prices have moderated somewhat in recent months, the data for July saw an increase in electricity prices alongside a moderate rise in gas prices (Figure 7). Services have remained a persistent source of price pressures, continuing to add close to 2 percentage points to the headline rate during 2026. Non-energy industrial goods inflation stood at an average of 1 per cent in the first half of 2026, largely shaped by methodological revisions discussed in Box D of QB1 2026.
HICP inflation has remained above 3 per cent since the energy price surge in spring 2026
Figure 6: Contributions to headline inflation, year-on-year per cent change (%)
Source: SDW. Chart data in accessible format (XLSX 176.07KB).
Moderation in liquid fuel prices has slowed energy price growth, while electricity and gas prices edge higher
Figure 7: Contributions to energy inflation, year-on-year per cent change (%)
Source: Eurostat. Chart data in accessible format (XLSX 176.07KB).
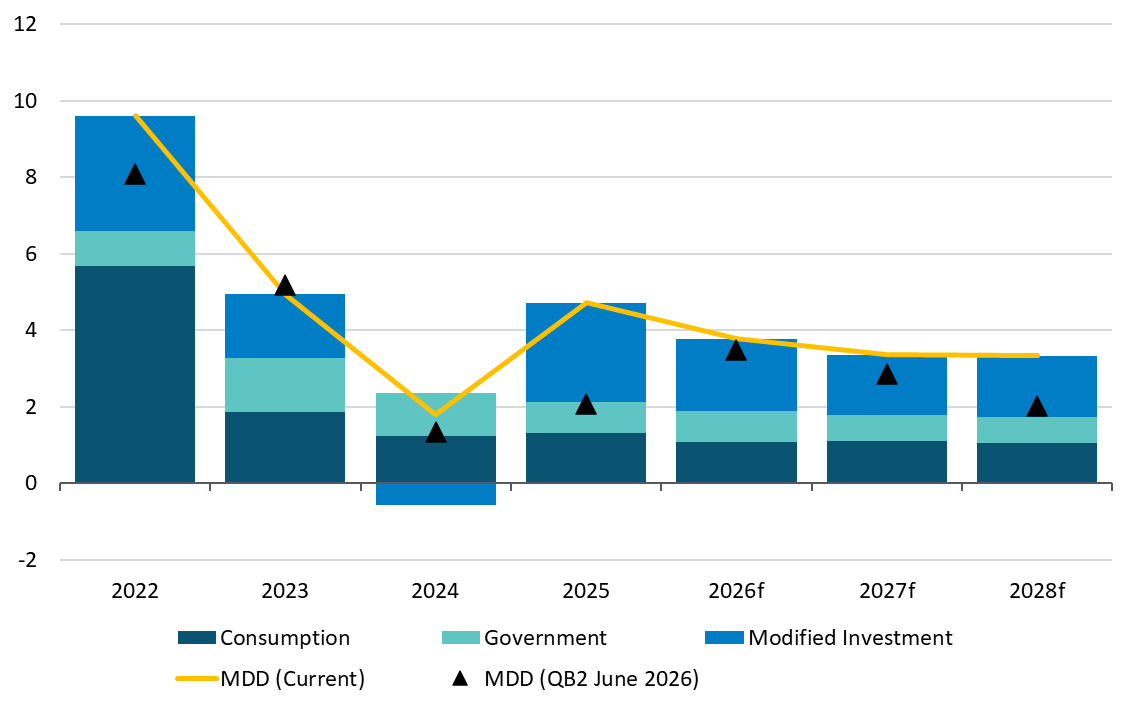
Modified investment is projected to support MDD growth alongside steady consumption
Figure 8: Contributions to annual change in MDD, percentage points, (p.p)
Source: CSO, Author's Calculations. Chart data in accessible format (XLSX 176.07KB).
In the face of ongoing inflationary pressures, modified domestic demand is projected to continue expanding, supported by modified investment and steady consumption growth. The central forecast is based on an assumed market-implied path for oil and gas futures prices as of mid-August 2026. While these assumptions for oil prices have been revised down since the last Bulletin, wholesale electricity price projections have been revised up significantly. This in part reflects the impact of earlier rises in oil and gas prices. Headline inflation is projected to average 3.4 per cent in 2026, moderating to 3.1 per cent in 2027 and 2.0 per cent in 2028. This represents a slight downward revision for 2026 relative to the QB2 projections, but an upward revision in 2027. In the light of a strong Q2 outturn, and the strength of high-frequency indicators, the outlook for consumption has improved slightly relative to the previous Bulletin. Modified investment is expected to continue building on the strong momentum from 2025 and the first half of 2026. AI and data-centre related investments, in particular, are expected to continue to play an important role, as evidenced by the continued strong growth in AI-related imports. A stronger outlook for machinery and equipment investment offsets weaker projections for non-residential building and housing completions than in the previous Bulletin. The latter are revised down slightly based on more subdued data for key leading indicators of housing output since QB2 as well as new information pointing to a lengthening in the typical duration of the housing completion process. The net result is that overall MDD growth is being revised up modestly in 2026 and 2027, to 3.8 and 3.4 per cent, respectively (Figure 8). The central projections are sensitive to the assumed path of energy prices and realised outturns on investment and imports of AI and data-centre related capital goods, which are both subject to significant uncertainty, as discussed in the Balance of Risks.
Growth in imports is projected to outpace that of exports in 2026, leaving net trade contributing negatively to GDP growth, before recovering in 2027 and 2028. Real exports of goods and services are projected to grow by 1.2 per cent in 2026, 6.6 per cent in 2027 and 5.7 per cent in 2028. Real imports are projected to increase by 5.2 per cent in 2026, supported by strong AI-related goods imports and imports of royalties and licenses - both of which showed very strong growth over the first half of this year. Combined with the outlook for domestic demand, this underpins the forecast for growth in real modified national income (GNI) of 3.1 per cent per annum on average from 2026 to 2028, slightly below the average expected growth in MDD over the same period (Table 1). The modified current account is expected to remain in surplus over the forecast horizon, projected to average 5.8 per cent of nominal GNI*.
Risks to the growth outlook are balanced, with upside risks to investment and consumption offsetting downside risks related to continued geopolitical tensions in the Middle East. The balance of risks to the inflation outlook is primarily to the upside, with the main risk stemming from a further prolongation of geopolitical tensions in the Middle East. Further increases in oil and gas prices could generate spillover effects into other components of inflation, beyond what is currently incorporated in the projections and, coupled with potential second-round effects from wage adjustments, risk adding further upward pressure to prices. The balance of risks to the export forecast is to the downside given the high level of concentration in pharma and ICT exports, with pharmaceutical demand, the location of production and the timing of multinational transactions presenting both upside and downside risks. AI-related developments are likely to have a meaningful impact on the economy over both the short and medium term. The magnitude and nature of these changes are highly uncertain. In the short term, risks to activity are tilted to the upside on the basis of the strength of AI capital expenditure, somewhat offset by downside risks from potential equity market adjustments and labour market effects. The resilience of private consumption in the face of the recent rise in inflation is an additional source of upside risk. In the light of population growth being at the high end of previous CSO long-term projections and with economic growth forecast to continue, capacity constraints could become worse if progress on alleviating infrastructure gaps in the economy is delayed or inadequate. This is particularly the case for housing output, where improvements in the timing of infrastructure delivery, particularly water and metered electricity connections, are needed. Government expenditure growth is running well in excess of the growth in tax revenue when excess corporation tax is excluded, presenting a material downside risk to the public finances (see Balance of Risks to the Outlook).
Table 1: QB3 September 2026 Forecast Summary and Revisions from June 2026 Baseline Projections
| | 2024 | 2025 | 2026f | 2027f | 2028f |
|---|
Constant Prices | | | | | |
| Modified Domestic Demand | 1.8 | 4.7 | 3.8 | 3.4 | 3.3 |
| Modified Gross National Income (GNI*) | 6.4 | 4.7 | 3.1 | 3.1 | 3.2 |
| Gross Domestic Product | 3.6 | 8.0 | -1.4 | 4.3 | 4.3 |
| Total Employment | 2.7 | 2.2 | 1.2 | 2.1 | 1.8 |
| Unemployment Rate | 4.3 | 4.7 | 5.1 | 5.1 | 5.2 |
| Harmonised Index of Consumer Prices (HICP) | 1.3 | 2.1 | 3.4 | 3.1 | 2.0 |
| HICP Excluding Food and Energy (Core HICP) | 2.3 | 2.0 | 2.9 | 3.1 | 2.5 |
Revisions from previous Quarterly Bulletin (percentage points) | | | | | |
| Modified Domestic Demand | 0.0 | -0.2 | 0.5 | 0.6 | 0.0 |
| Gross Domestic Product | 1.0 | -4.3 | 1.3 | -2.2 | 0.3 |
| HICP | 0.0 | 0.0 | -0.1 | 0.2 | 0.0 |
| Core HICP | 0.0 | 0.0 | -0.1 | 0.3 | 0.2 |
Forecast Detail
External Environment
With renewed escalation of the US-Iran conflict arising, elevated oil and gas prices continue to disrupt the world economy. Up to recently, energy prices had stabilised somewhat compared to the initial stages of the conflict, owing to a fragile ceasefire. However, as the ceasefire has now expired, and following renewed military escalation, oil and gas prices have been rising again, with oil prices breaking the $100 mark in early September. In response to the increase in energy prices, and the inflation outlook, a number of major central banks have reacted by raising policy interest rates. Across the world, the effects of the conflict vary, with energy importers (including the euro area and Japan) and emerging markets being the most affected. The July 2026 update to the IMF World Economic Outlook expects global GDP growth of 3.0 per cent in 2026 (3.4 per cent in 2027), down from 3.5 per cent last year, reflecting the impact of the conflict. Given the worldwide effects of elevated energy prices, global inflation is also projected to rise this year to 4.7 per cent, stalling the global process of disinflation that was underway before the conflict. Long-term bond yields have also been rising throughout advanced economies, most notably in the US and Japan, as high public debt levels meet with rising inflation and policy rate expectations and uncertain long-term growth outlooks.
Against the backdrop of the energy shock, output growth remains steady but fragile in major economies. US GDP grew at an annualised quarterly rate of 1.5 per cent (0.4 per cent quarter-on-quarter) in the second quarter. Despite the erosion in real income growth due to the recent conflict-related rise in inflation, consumer demand (contributing 2.3 percentage points to growth) remains strong. It has been partly supported by a buoyant stock market, reflecting optimism surrounding AI investment, which has also been driving demand, and strong company earnings. The euro area economy grew by 0.6 per cent in Q2 2026, rebounding from a flat first quarter (which partly reflected volatility in Irish GDP data) and demonstrating resilience in the face of multiple shocks. In year-on-year terms, euro area GDP grew by 1.2 per cent, while employment rose by 0.5 per cent. At the EU level, output per person employed rose by 0.9 per cent annually in Q2, in part reflecting a cyclical recovery. The relatively low growth in productivity in the euro area is a longer-term vulnerability, alongside demographic changes and competitive pressures. The Chinese economy grew by 4.3 per cent year-on-year in Q2 2026, down from 5.0 per cent in the previous quarter and falling short of the target range of 4.5 to 5 per cent GDP growth for the year. The economy continues to be characterised by a heavy reliance on foreign demand, as stagnant domestic demand (with retail sales growing by only 0.6 per cent year-on-year in July) is balanced by persistent strength in external trade. Strong export growth (in particular, of high-tech goods exports) is supporting manufacturing production, while the weakness in domestic demand is, in large part, owing to a prolonged slump in property prices that is affecting households' balance sheets and confidence.
In September, the ECB macroeconomic projections for the euro area were revised up for both inflation and growth. In the baseline projections, euro area inflation is forecast to average 3.0 per cent in 2026, 2.5 per cent in 2027 and 2.1 per cent in 2028, driven by higher commodity prices. Reflecting greater than expected resilience in the euro area economy, the projections see euro area GDP growing by 0.9, 1.4 and 1.5 per cent, respectively, in the same years. At its September meeting, the Governing Council of the European Central Bank, recognising the inflationary pressures generated by the conflict in the Middle East, decided to raise the key ECB interest rates by 25 basis points, bringing the interest rate on the deposit facility rate (DFR) to 2.50 per cent. The DFR was last raised to 2.25 per cent in June 2026, in response to the energy price shock. With these policy decisions, the Governing Council noted it is well-positioned to navigate the highly uncertain outlook created by the conflict; it is not pre-committing to any particular interest rate path and maintains a data-dependent approach to monetary policy.
Economic Activity
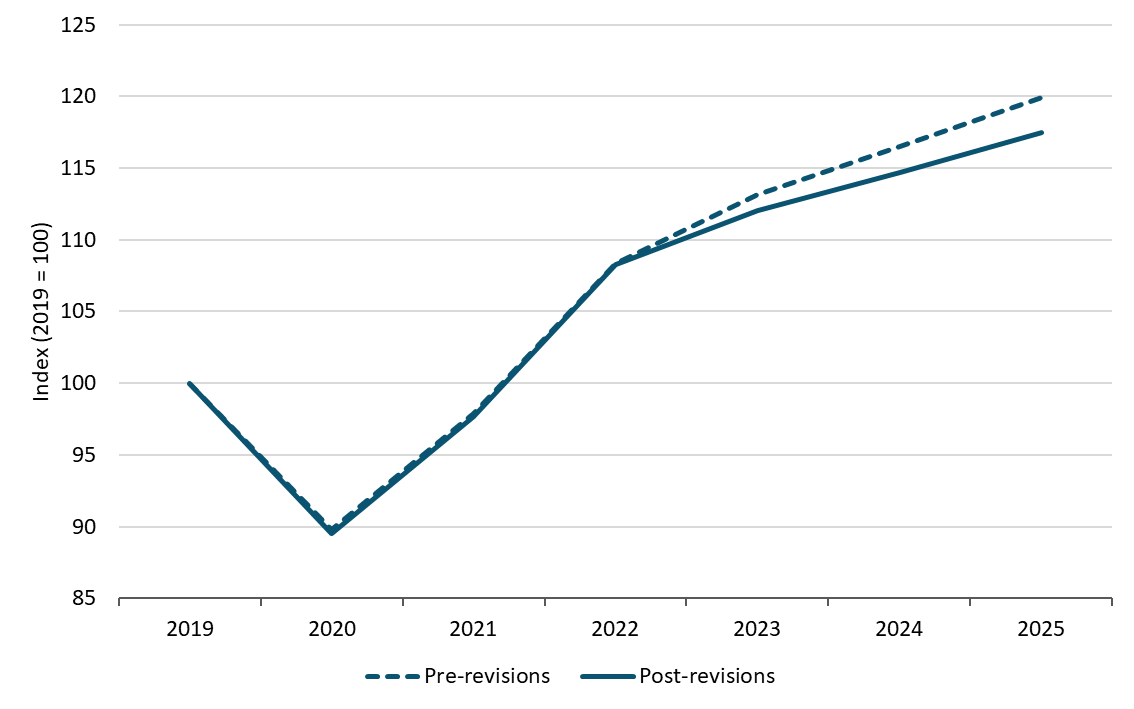
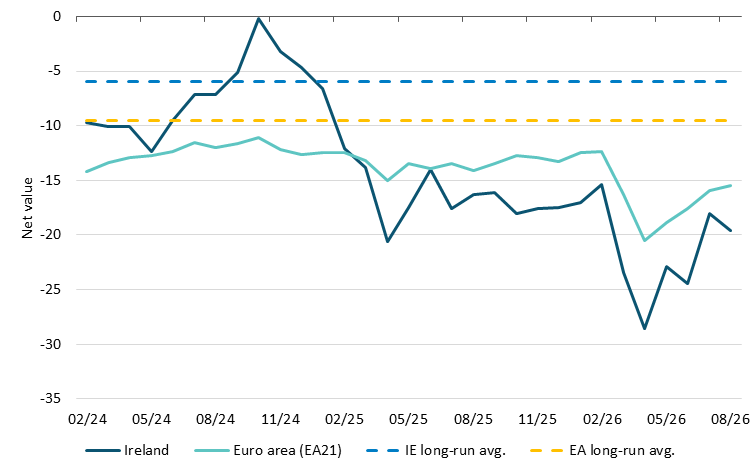
Consumption is forecast to grow by 2.1 per cent in 2026 and 2.2 per cent in 2027 before easing to 2.1 per cent in 2028, marking an upward revision for 2026 from 1.8 per cent in the previous Bulletin. A small part of the 2026 uplift in the forecast is a mechanical adjustment resulting from the CSO's July Annual National Accounts revisions to historical data (Figure 9). This arises because the revisions lowered consumption in 2025, thereby mechanically increasing the growth rate for 2026. Recent outturns for 2026 and high-frequency indicators show that, despite inflationary headwinds, spending has been resilient. The sharp fall in consumer confidence that followed the US invasion of Iran has largely unwound, with Irish consumer confidence recovering to -19.6 in August from a trough of -28.6 in April, closing most of the gap to the euro area value (Figure 10). Population growth also continues to support aggregate consumption, with population levels increasing by 1.2 per cent in the twelve months to April 2026. Over the forecast horizon, consumption growth is expected to be supported by continued employment growth and modest real income gains.
Household consumption has been revised down back to 2022
Figure 9: Path for household consumption pre and post 2025 Annual National Accounts, Index (2019 = 100)
Source: CSO. Chart data in accessible format (XLSX 176.07KB).
Consumer confidence has recovered from its April trough, narrowing the gap to the euro area
Figure 10: Consumer confidence index for Ireland and the euro area (net value)
Source: European Commission.
Note: The EC's consumer confidence indicator is a net balance of responses covering HH finances over the past and next 12 months, the general economic situation, and major purchases. The series is the weighted share of positive answers minus the weighted share of negative ones. A value of -18 means that, after weighting, 18 per cent more consumers gave negative answers than positive ones. The long-run averages are based on data since January 1985. Latest observation August 2026. Chart data in accessible format (XLSX 176.07KB).
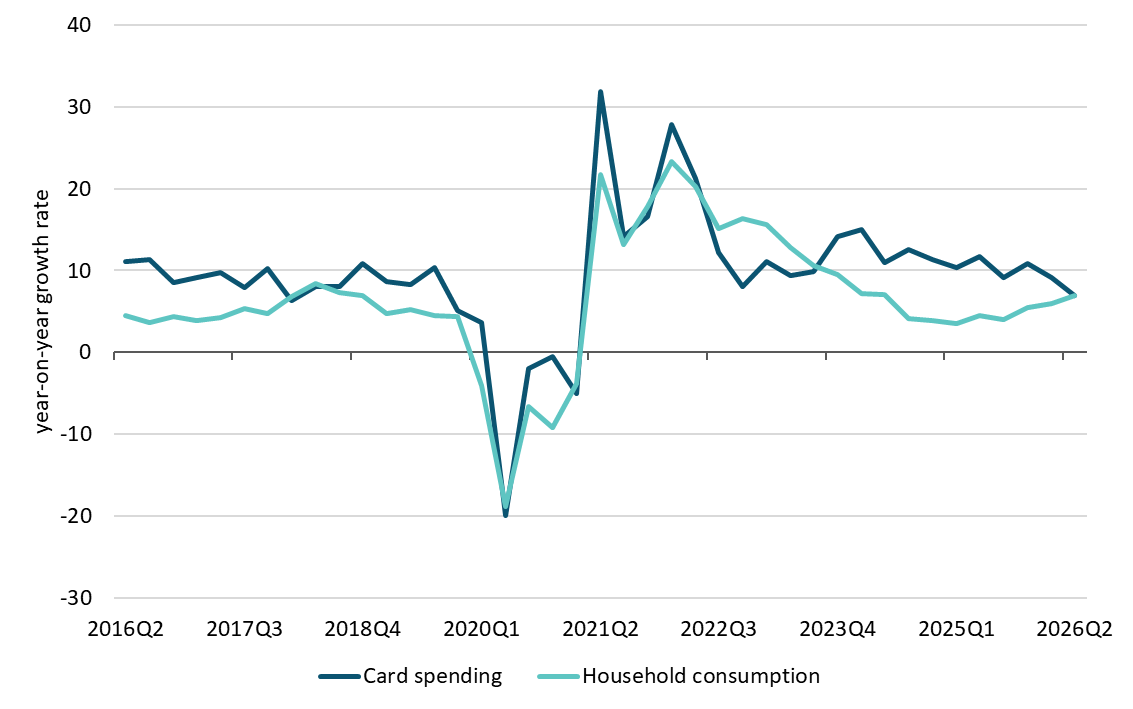
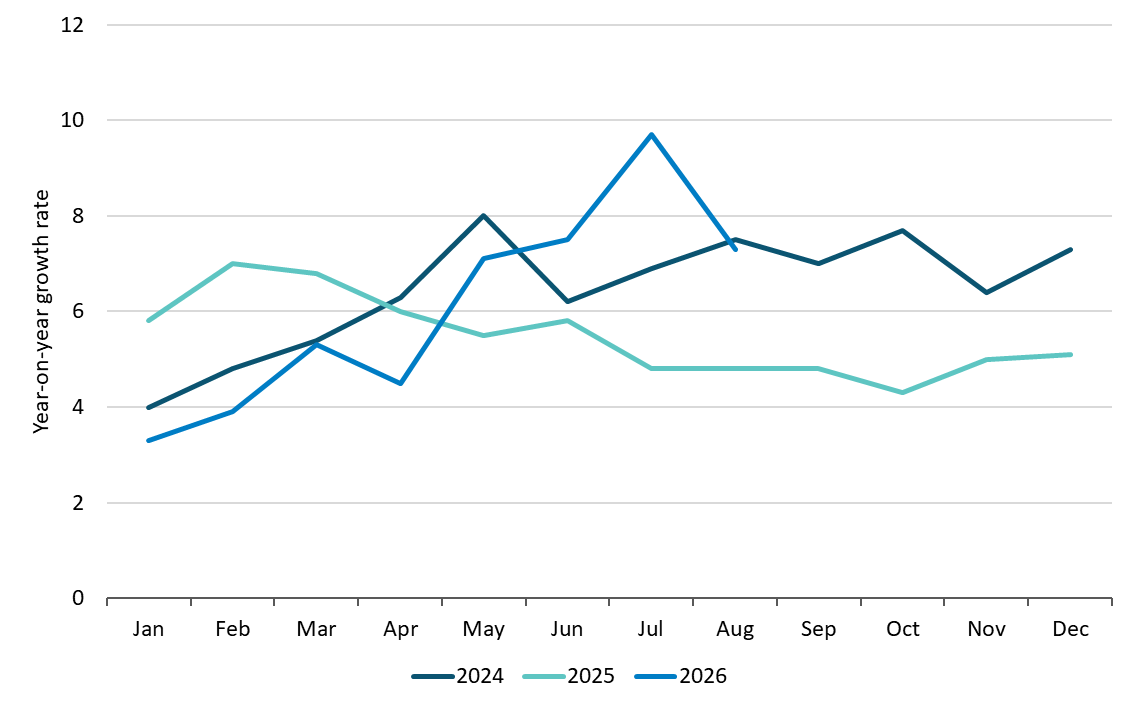
The latest National Accounts confirm that consumption continued to expand in Q2 2026, consistent with resilient high-frequency spending indicators. Real household consumption increased by 2.9 per cent year-on-year and by 1.0 per cent quarter-on-quarter in Q2. Growth in nominal spending using bank cards slowed from around 10.5 per cent in 2025 to 6.9 per cent in the year to Q2 2026 (Figure 11). Within the card data, Q2 growth was broad-based, with groceries growing by around 5 per cent in volume terms, while durables and electrical goods grew by 12 and 24 per cent, respectively. HICP-deflated card spending grew by 3.4 per cent year-on-year in Q2, down from 6 per cent in Q1, while retail volumes excluding motor trades were broadly flat. More recent retail sales data point to continued spending growth into Q3, with July volumes up 1.3 per cent on the month and 2.2 per cent year-on-year. Exchequer VAT receipts increased by 7.3 per cent in the first eight months of the year (Figure 12). Taken together, these indicators suggest that consumption growth has remained solid in 2026 and is more resilient than previously expected.
Card spending growth has moderated slightly in recent months
Figure 11: Year-on-year growth rate (%)
Source: CBI card payment statistics.
Note: Retired and current series are joined by ratio-splice at the March 2023 coverage change. Chart data in accessible format (XLSX 176.07KB).
VAT receipts have been growing at a faster rate in recent months
Figure 12: Year-on-year growth rate of cumulative year-to-date receipts (%)
Source: Department of Finance Fiscal Monitors.
Note: Monthly tax receipts to August 2026. Since data on VAT are bimonthly, we take annual growth rates of year-to-date collections to smooth interim months. The increase in growth in July 2026 partly reflects refund timing holding down the July 2025 outturn. Since data are based on nominal values, part of the increase may be due to inflationary effects. Chart data in accessible format (XLSX 176.07KB).
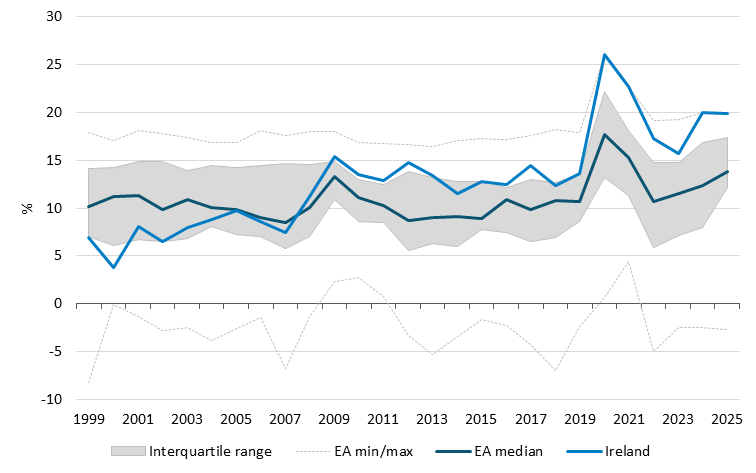
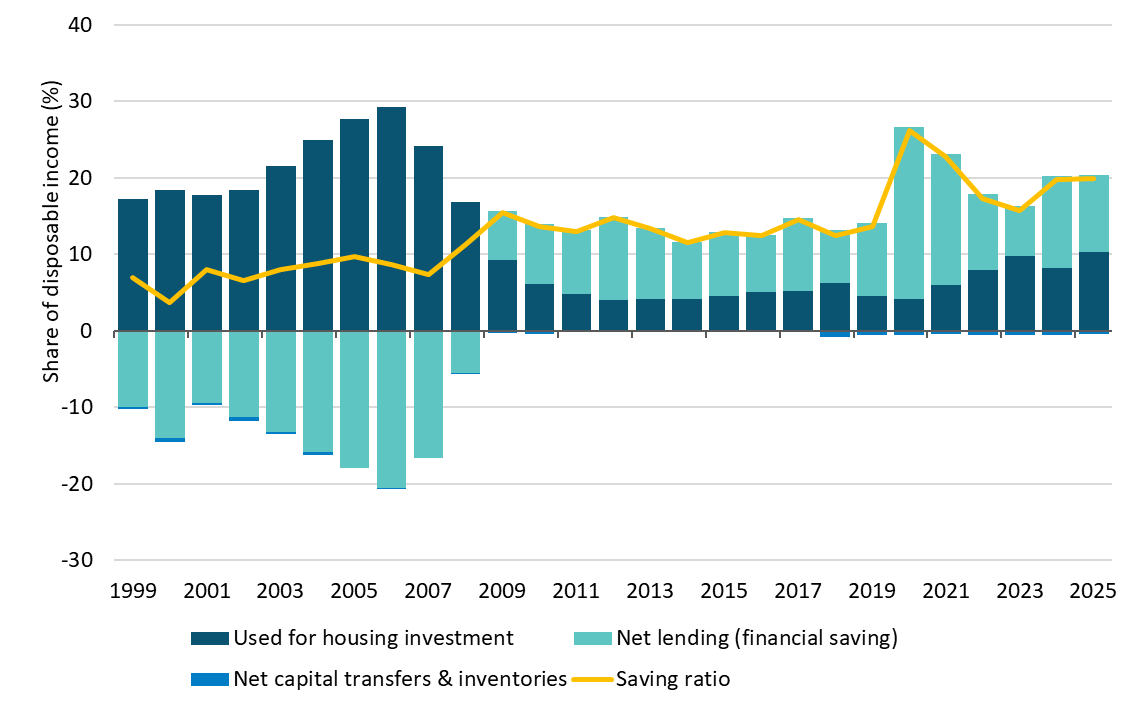
The savings ratio is projected to remain elevated over the forecast horizon, with structural factors at play. The Institutional Sector Accounts revised up income and, combined with downward revisions to consumption in the Annual National Accounts, the savings ratio increased sharply for the period 2023-25 (Figure 13). The savings ratio for 2025 now stands at 19.9 per cent, up from 12.9 per cent prior to the revision. This reflects an increase in aggregate gross savings of €14.4bn to €38.4bn (+60.3 per cent) in 2025 compared with the previous data. CSOs provisional estimate for Q2 2026 puts the seasonally adjusted savings ratio at 19.9 per cent, up from 19.1 per cent in Q1, as income growth outpaced consumption. Ireland now has the highest household savings rate among reporting euro area countries. The euro area median for 2025 is 13.8 per cent among the eleven countries reporting so far, with Ireland ahead of Germany (19.9 versus 19.2 per cent). Of the roughly 20 per cent of income saved, about half is now used for housing investment, which includes dwellings and improvements. This stood at 10.3 per cent of income in 2025, more than double the 2019 share and the highest since 2008 (Figure 14). The remainder of household savings is used to accumulate financial assets such as deposits, pension contributions, insurance and stocks and bonds. Research shows that structural factors, including an ageing population and an increased propensity to save for housing among younger cohorts, alongside higher levels of uncertainty and precautionary savings motives have supported a gradual upward drift in the household savings ratio over recent years (Boyd, Byrne and McIndoe Calder, 2025) (PDF 1.05MB).
The household savings ratio has been revised sharply upwards for 2020-2025, with Ireland now highest in the euro area
Figure 13: Gross savings to gross disposable income (%)
Source: CSO and Eurostat.
Note: For EA countries with no published annual accounts for 2025 yet the 4 quarters of 2025 are summed. Chart data in accessible format (XLSX 176.07KB).
Around half of household savings are now used for housing investment, with the other half used for accumulating financial assets
Figure 14: Decomposition of savings to gross disposable income (%)
Source: CSO. Chart data in accessible format (XLSX 176.07KB).
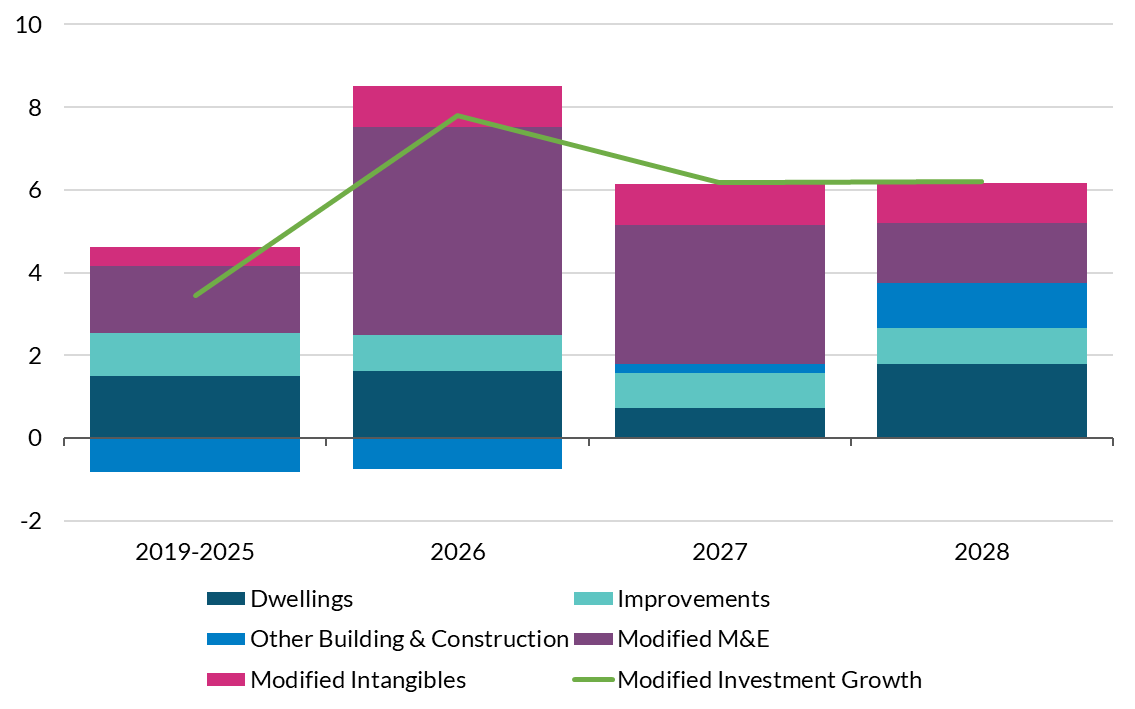
Forecasts for overall modified investment have been revised upwards from the previous Bulletin to an average of 6.7 per cent from 2026 to 2028, driven primarily by stronger multinational-dominated machinery and equipment spending. Recent trade data and a significant investment announcement by a major player in the ICT sector suggest that investment in modified machinery and equipment (M&E) is likely to be higher than previously anticipated. Much of this investment is allied to a small number of large multinational enterprises (MNEs) in the ICT sector which is focussed on AI and data centre investments. Modified M&E is forecast to grow by an average of 12.3 per cent over the forecast horizon. Following strong growth in 2025, modified intangibles are also forecast to increase by an average of 6 per cent over the same period. However, these components of modified investment are dependent on the activities of a small number of large foreign-owned firms and are therefore particularly volatile in nature (Figure 15).
Modified investment growth is projected to be broad-based but led by modified M&E investment
Figure 15: Year-on-year growth contributions
Source: CSO and Central Bank of Ireland. Chart data in accessible format (XLSX 176.07KB).
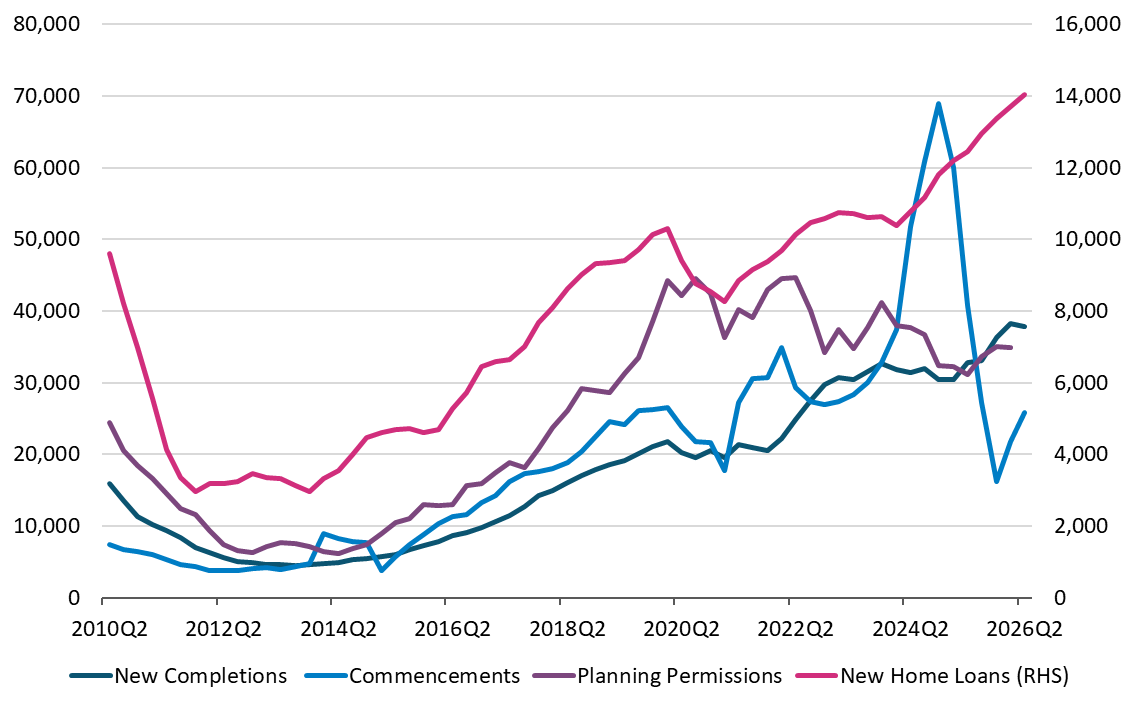
Housing completions are forecast to reach 39,500, 41,000 and 45,000 for 2026, 2027 and 2028, respectively, revised down slightly from the previous Bulletin and conditional on improvements in enabling infrastructure. For this year, while Q2 completions fell by 3.6 per cent year-on-year to 8,823 and the outturn was weaker than anticipated, growth in the second half of the year is likely to pick up as firms aim to meet the deadline for conditions set out in the development levy and Uisce Éireann rebate. While there have been over 100,000 commencements since 2024, the timing around housing and apartment delivery suggests that without further improvements in commencements and building time, current projections may be difficult to meet (Box B). Planning permissions have stagnated with an annual average of approximately 35,000 arising since 2023. Commencements amounted to approximately 16,000 units in H1 2026. This follows a surge in 2024 due to the expiry of energy and water connection waivers followed by very low levels throughout 2025 (Figure 16). The house price to cost index increased by 2.6 per cent in Q2 2026, improving viability of some schemes. However, longer building times and uncertainty around infrastructure means that some of the uncommenced permissions are unlikely to result in final completions in the timeline of the forecast horizon (Box A). Mortgage drawdowns for properties increased by 12.3 per cent year-on-year in the first half of 2026. The housing PMIs returned to positive territory in July 2026 having signalled a contraction in activity for the previous three months (Figure 17).
Housing completions in Q2 below expectations but likely to pick up in H2
Figure 16: Annualised units
Source: CSO. Chart data in accessible format (XLSX 176.07KB).
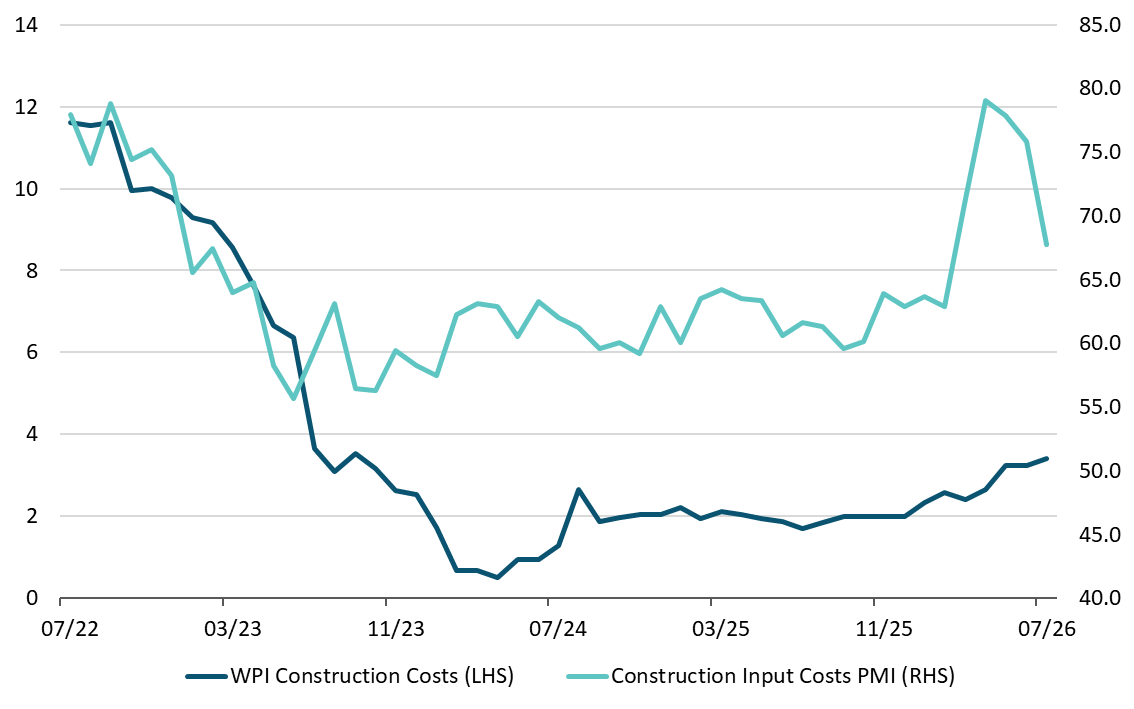
Building costs are increasing, although the construction PMI input cost indicator has moderated in recent months
Figure 17: Year-on-year change and index
Source: CSO and Central Bank of Ireland. Chart data in accessible format (XLSX 176.07KB).
Machinery and equipment imports continued to rise strongly in Q2 2026. Their value increased by 56 per cent year on year, with office machinery and data-processing equipment accounting for over half of the increase. Imports of this equipment rose by 114 per cent, while imports of specialised machinery and telecommunications equipment increased by 128 per cent and 45 per cent, respectively (Figure 18). These developments are consistent with continued AI and data centre investment and the imports of the hardware typically used in them. However, not all such imports translate into domestic fixed investment, as some may be used as inputs into goods subsequently exported.
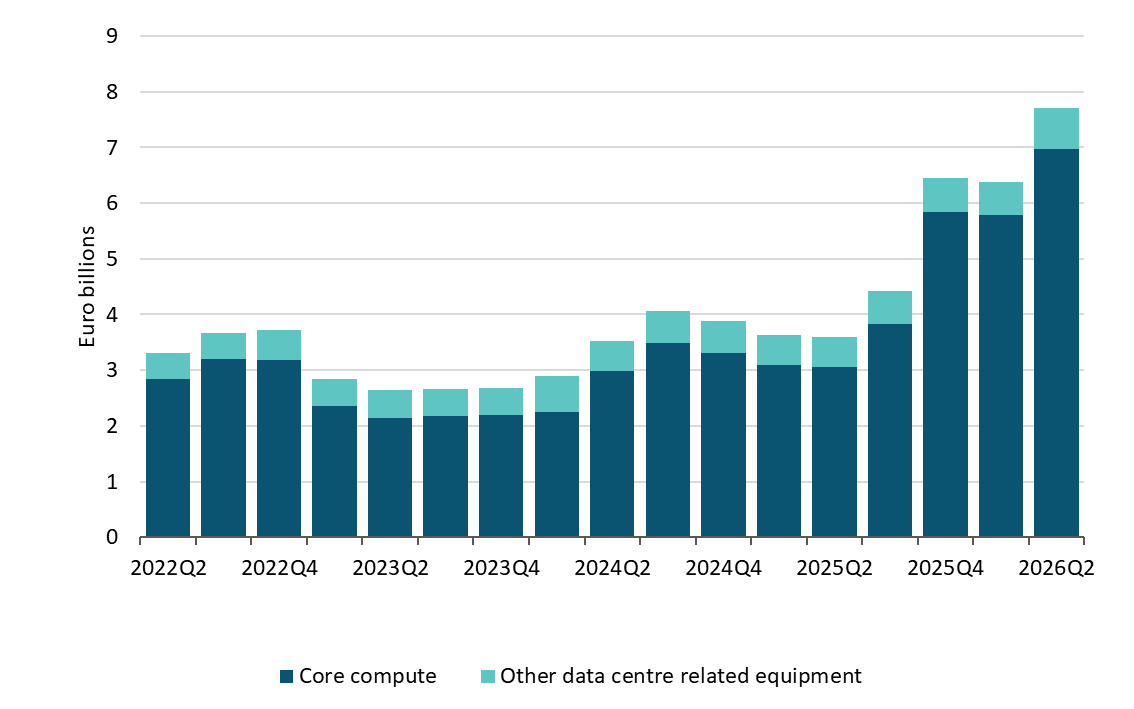
Recent quarters have seen a substantial increase in data centre and AI-related imports
Figure 18: Imports of AI-related goods, €billion
Source: CSO and authors calculations (see Box A Quarterly Bulletin 2, 2026). Chart data in accessible format (XLSX 176.07KB).
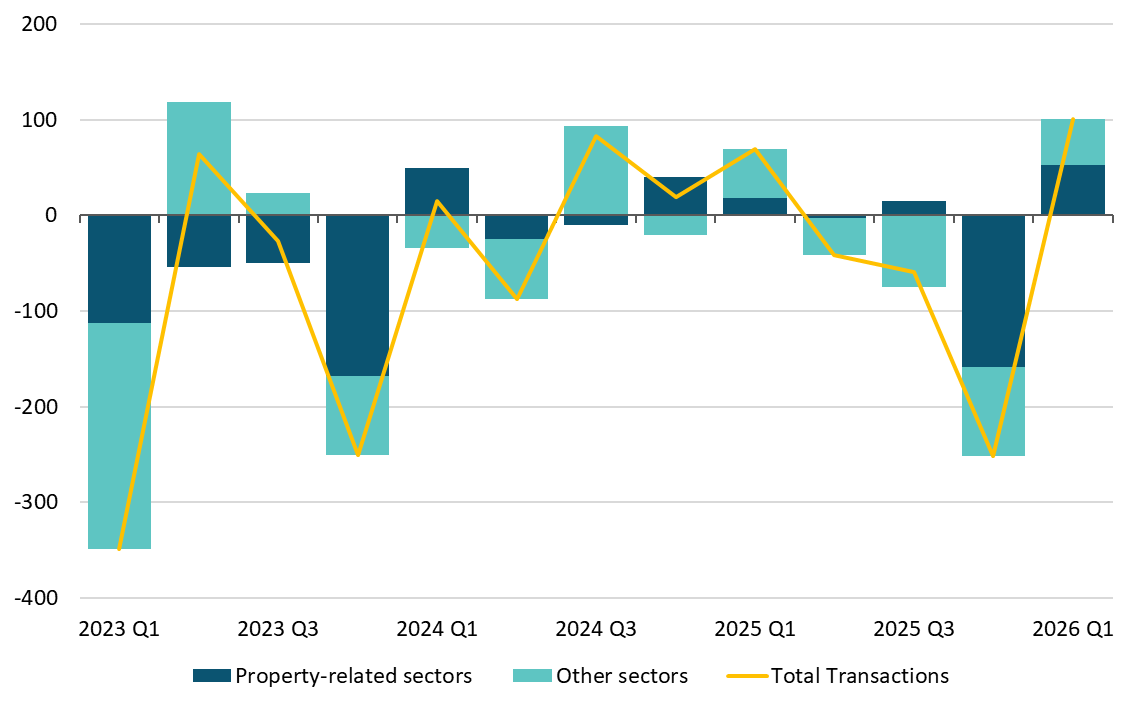
Bank lending to SMEs showed tentative signs of stabilisation in Q1 2026. Outstanding loans increased by 0.8 per cent over the quarter to €14.6 billion, although they remained 2.1 per cent below their level a year earlier. New drawdowns exceeded repayments, resulting in positive net lending of €100 million, with increases across both property-related and other SMEs (Figure 19). Gross new lending was also 12.8 per cent higher than Q1 2025. More recent data for non-financial corporations as a whole show positive bank lending of €479 million in July 2026. Non-bank lending remained concentrated on SMEs. In Q4 2025, the latest available period, non-bank new lending amounted to €858 million, down from €1.3 billion in Q4 2024. SMEs received 83 per cent of this lending, with general lenders and specialist property lenders providing similar amounts. Asset finance providers were the largest category of non-bank lender to large enterprises.
Net lending to SMEs was positive in Q1 2026 across both property and non-property sectors
Figure 19: Net transactions to SMEs (€m)
Source: Central Bank of Ireland. Chart data in accessible format (XLSX 176.07KB).
Annual National Accounts revisions had a substantial effect on nominal GDP and trade data for 2025, with implications for the outlook. The annual national accounts reduced 2025 nominal GDP by €36bn (down 5.7 per cent relative to the previous estimate), with 84 per cent of the revision arising from changes in net trade. Goods exports were revised down by €27bn while services exports were revised up by €17bn. Real export growth in 2025 is now measured at 7.5 per cent (goods 15.4 per cent, services 2.3 per cent) compared to 9.7 per cent prior to the revision. The revised levels and composition of trade provide a materially different starting point for the current projections. Notably, the goods-export revision largely came through 'other conceptual adjustments' in the balance of payments, which went from -€19bn to -€48bn. These adjustments reconcile customs-based merchandise trade with balance-of-payments concepts, particularly the change of economic ownership and market valuation. This category is expected to contribute positively to goods exports in 2026.
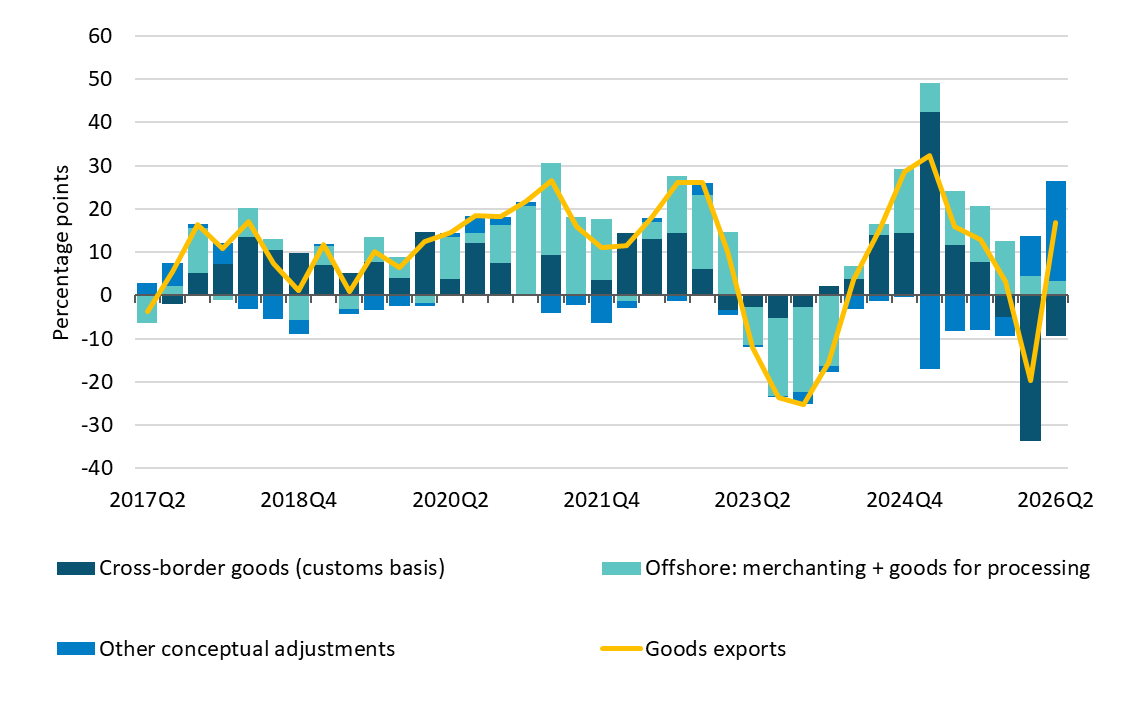
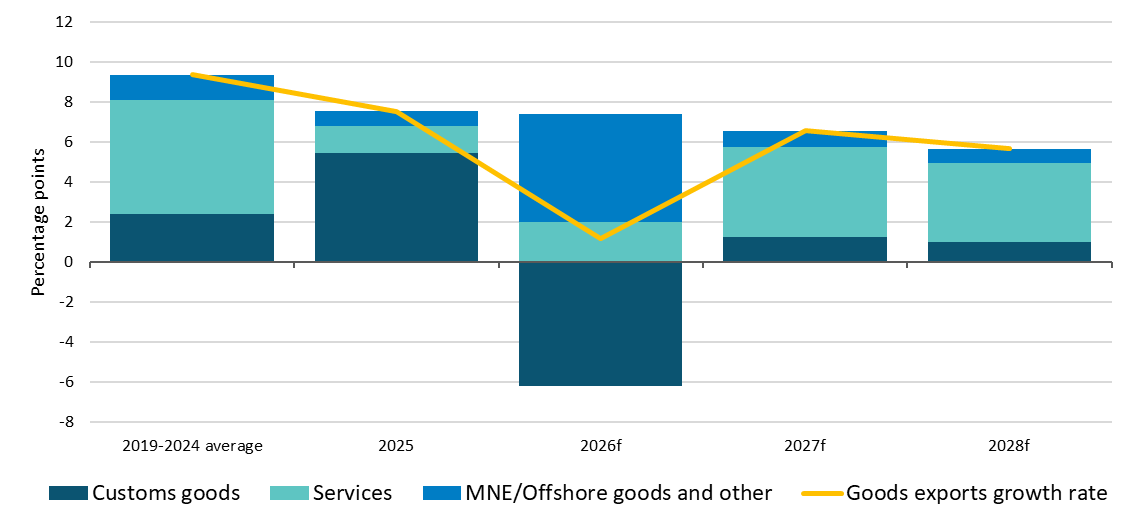
Exports of goods and services are forecast to grow by 1.2 per cent in 2026, 6.5 per cent in 2027 and 5.6 per cent in 2028, with services forecast to account for about 70 per cent of export growth in 2027 and 2028 (Figure 23). Despite strong growth in computer services, exports were relatively weak in the first half of 2026. Computer services are expected to continue their momentum in the second half of the year contributing to overall services growth in 2026 of 3.5 per cent, followed by a pick-up to 7.7 per cent in 2027 and 6.8 per cent in 2028. Tariff-related stockpiling in Q1 2025 was the main driver of the 20 per cent decline in goods exports in the year to Q1 2026, although Q2 saw a rebound with year-on-year growth of 17 per cent. In the second quarter cross-border customs exports contributed negatively to year-on-year growth, with positive contributions from offshore trade and, particularly, other conceptual adjustments (Figure 20). As discussed in more detail below, among other things, this category accounts for valuation fluctuations in cross-border trade. It was the primary contributor to negative trade revisions in the 2025 Annual National Accounts, and its recent fluctuations appear to reflect in part the value-volume disconnect in cross-border pharmaceuticals exports referenced in Quarterly Bulletin 2.
Offshore goods exports and other conceptual adjustments have played a substantial role in Ireland's goods trade fluctuations recently
Figure 20: Contributions to year-on-year growth (p.p)
Source: CSO. Chart data in accessible format (XLSX 176.07KB).
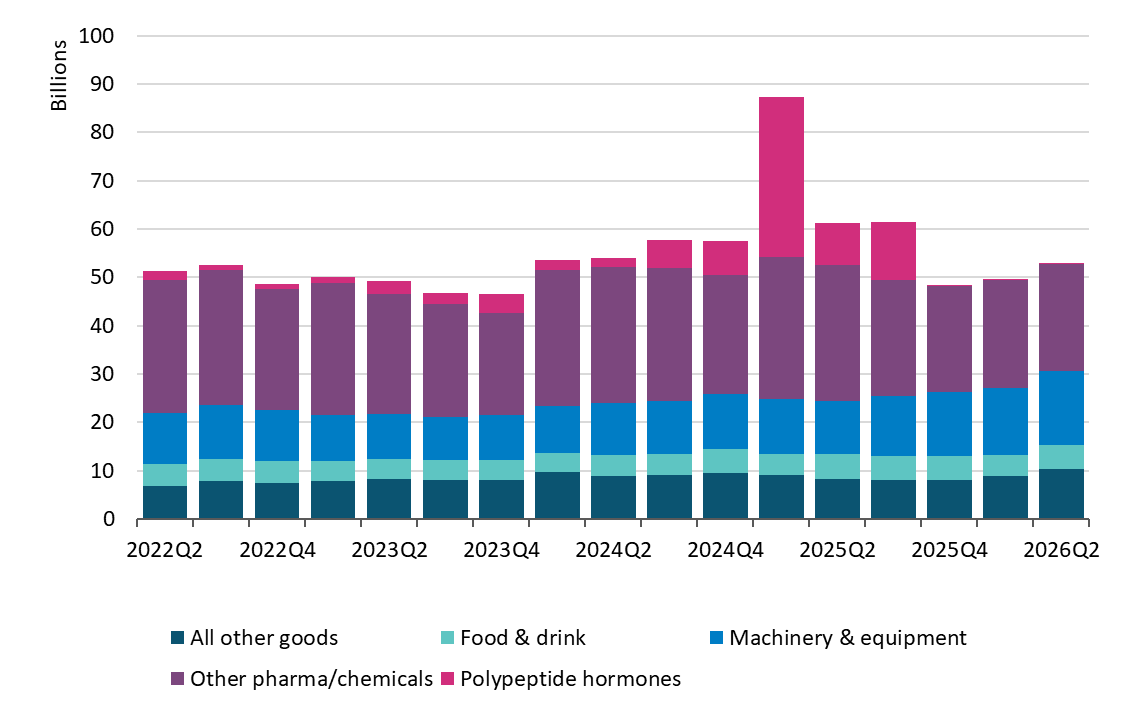
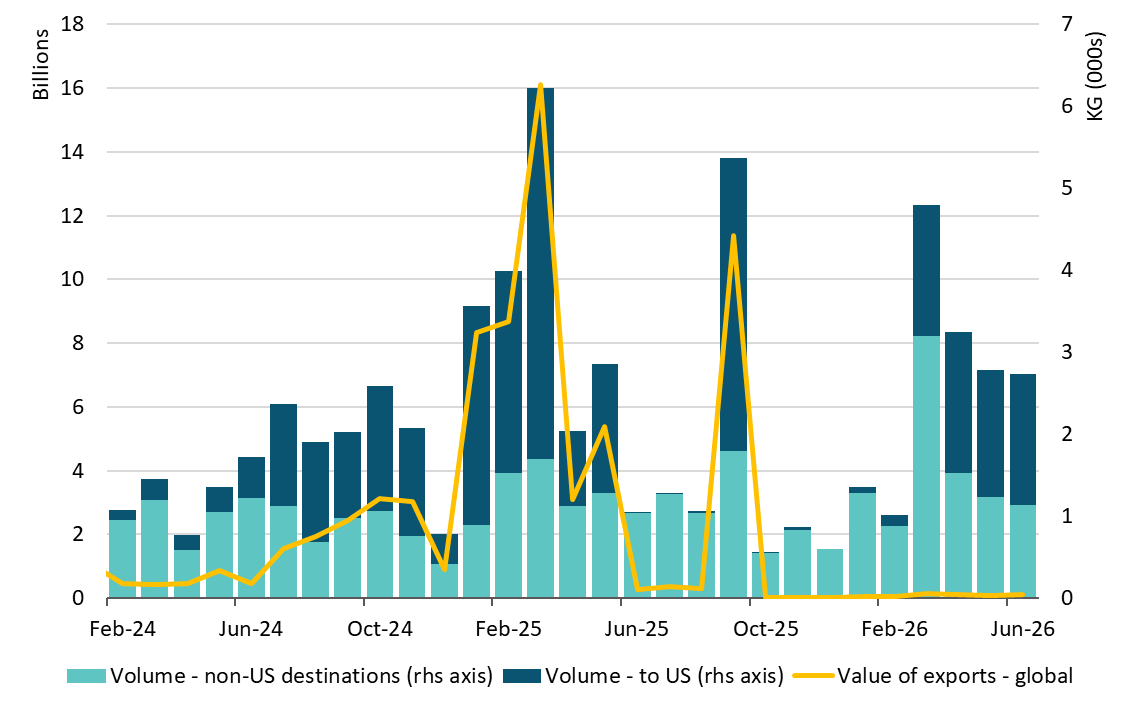
Cross-border customs goods exports remained substantially below 2025 levels in the first half of 2026, with the decline almost entirely attributable to lower pharmaceutical exports to the US, while exports of computer server equipment rose sharply. H1-2026 customs goods exports were 30.5 per cent lower than the same period in 2025, with the trade surplus falling by €54bn, of which pharmaceutical exports to the US accounted for €43bn (Figure 21). The fall in a specific category of pharma exports, polypeptide hormones (associated with weight-loss drugs), reflects low unit values rather than a halt in production volumes (Figure 22). Monthly polypeptide export values fell to around €20mn through Q4-2025 and have continued at similar levels over the first half of 2026 (H1 total €0.5bn versus €42bn in H1-2025). Physical export volumes (in KG weight) on the other hand have been comparable to 2025, resulting in a substantial fall in implied unit prices in recent months. Higher than average unit-values in 2025, followed by considerably lower than average unit-values in recent months are a likely contributor to recent offsetting fluctuations in other conceptual adjustments shown above (Figure 20), which could continue over the coming quarters. Exports of computer server equipment have risen sharply as Ireland is emerging as a major hub for such hardware. Exports of advanced data processing units (ADP) rose 155 per cent in H1 to €8.8bn and server/processing-unit exports rose seven-fold to €4.2bn, principally to Great Britain, the US, Canada and Norway.
The values of export goods excluding polypeptide hormones have been relatively stable so far in 2026
Figure 21: Euro billions (nominal values)
Source: European Commission. Chart data in accessible format (XLSX 176.07KB).
The value of polypeptide hormones exports dropped sharply in October 2025 and did not recover in 2026 despite a sharp pick up in recent export volumes to the US
Figure 22: Euro billions (nominal values) and 000s kg
Source: Eurostat. Chart data in accessible format (XLSX 176.07KB).
Services exports are expected to contribute most to overall export growth over the forecast horizon
Figure 23: Contribution to annual growth in exports (pps)
Source: CSO, Eurostat and Central Bank of Ireland calculations. Chart data in accessible format. (XLSX 176.07KB)
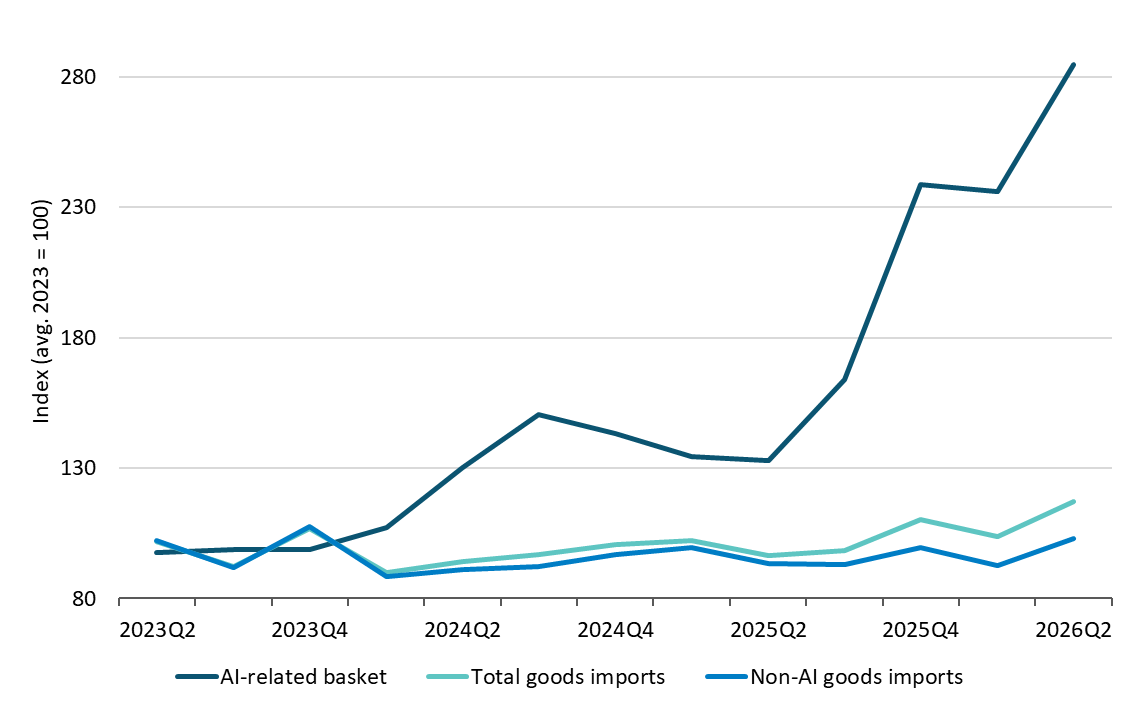
Real imports of goods and services are projected to grow by 5.2 per cent in 2026 and to average 5.9 per cent over 2027 and 2028, driven by royalties and licenses paid to US MNEs and imports of data-centre hardware goods. AI/data-centre-related hardware imports continued to grow to record highs in Q2 2026. As shown in Figure 24, the AI-related goods import basket increased sharply in Q2 2026 reaching €7.7bn, about a fifth above its Q4-2025 peak led by core compute/micro-chips (€7.0bn). A second, distinct capital channel - semiconductor-manufacturing equipment imports - tripled to €1.2bn between H1 2026 and H1 2025. Services imports slowed in Q1 2026 in year-on-year terms due to the unwinding of an R&D/IP transaction that occurred in Q1 2025. Real services imports increased in Q2 by 12.8 per cent year-on-year, following a 5.4 per cent decline in Q1. Royalties and licenses, which now account for about 40 per cent of services imports (around 85 per cent of which come from the US) grew by 7.8 per cent in Q1 and 15.7 per cent in Q2 and are expected to continue to mirror growth in computer services exports.
AI/data centre related imports have almost tripled since 2023, contributing to double digit growth in total goods imports
Figure 24: Index (average 2023 = 100)
Source: Eurostat. Chart data in accessible format (XLSX 176.07KB).
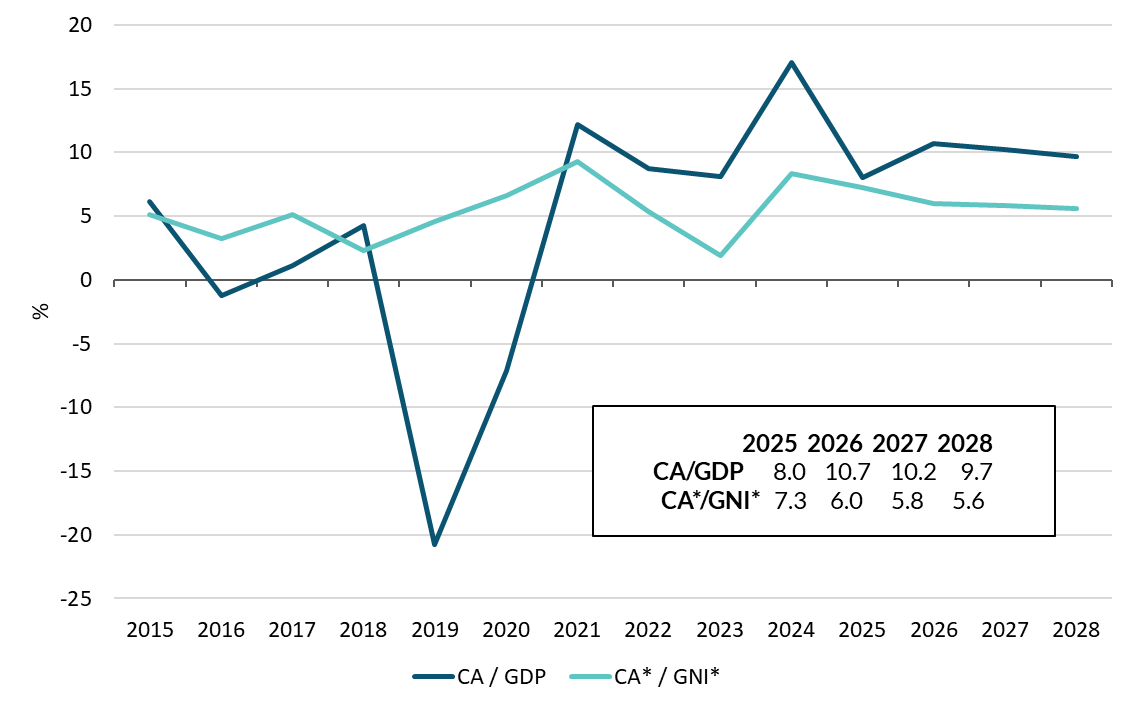
Ireland's external position is expected to remain in surplus over the forecast horizon, with the modified current account projected to average around 5.8 per cent of GNI* through 2028. The modified current account (CA*), which adjusts the headline measure for distortions caused by globalisation-related flows of foreign-owned multinationals, is forecast to measure 6 per cent of GNI* in 2026, falling gradually to 5.6 per cent in 2028. This decline reflects our expectation that higher housing, infrastructure and business investment gradually absorbs more national saving, while continued robust household saving still maintains the sizeable surplus. The surplus in the headline current account is expected to increase in 2026, following an increase to 13 per cent of GDP in the first half of this year. The headline surplus is forecast to be 10.7 per cent of GDP in full-year 2026, declining to 9.7 per cent by 2028 due to continued strength in imports and persistent large outflows of multinational companies' profits (Figure 25).
Headline and underlying external surpluses are forecast to remain sizeable
Figure 25: Share of nominal GNI*/GDP
Source: CSO and Central Bank of Ireland calculations. Chart data in accessible format (XLSX 176.07KB).
Inflation
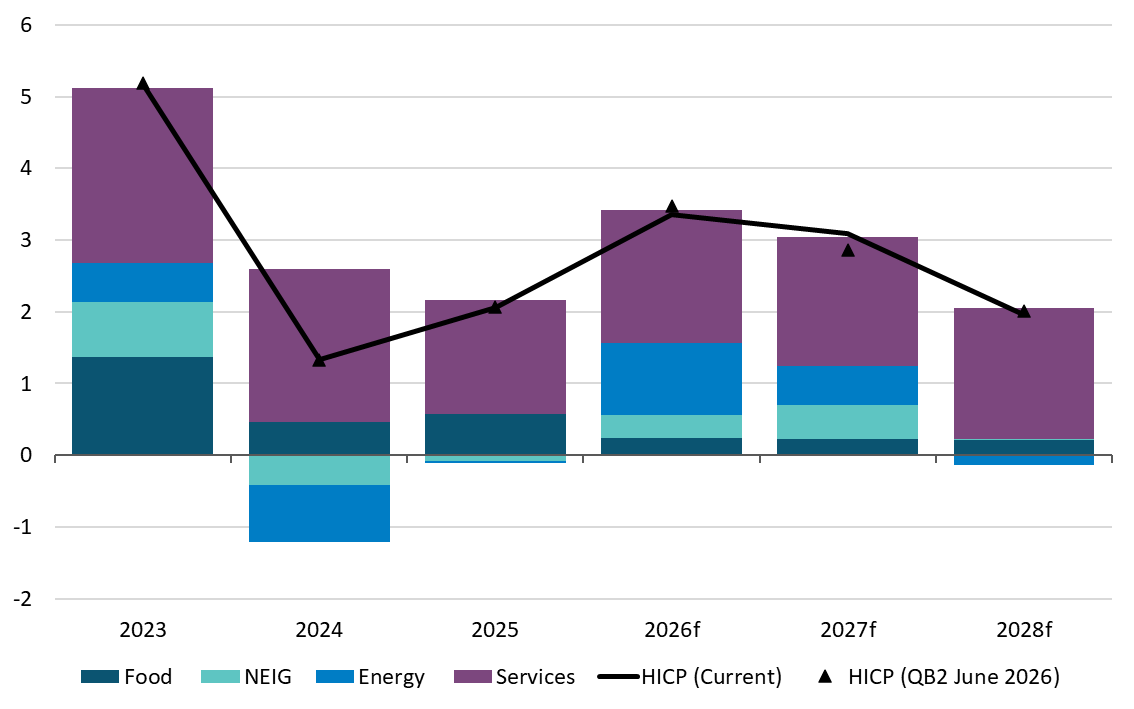
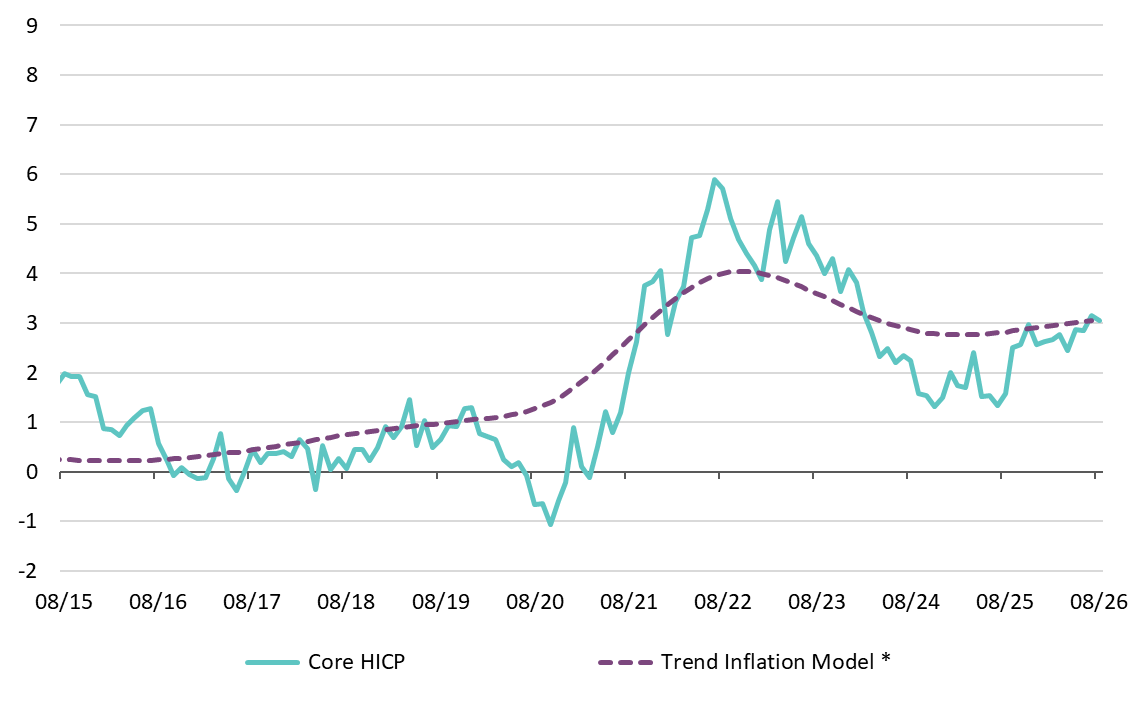
Headline Harmonised Index of Consumer Prices (HICP) inflation forecasts remain broadly consistent with those in the previous Bulletin, projected at 3.4 per cent in 2026 and 3.1 per cent and 2.0 per cent for 2027 and 2028, respectively (Figure 26 and Table 2). The slight downward revision for 2026 is largely attributable to the moderation in liquid fuel and food prices observed in the outturn data in recent months. Technical assumptions for energy prices now point to a marginally lower oil price trajectory relative to the previous Bulletin, partly offset by an upward revision to gas and wholesale electricity prices. While these divergent revisions to energy-related assumptions exert a marginal impact on the 2026 outlook, they constitute the main driver of the upward revision to the 2027 inflation forecast. Energy prices are projected to rise by 10.3 per cent in 2026, while non-energy industrial goods (NEIG) inflation continues to gain momentum on the back of this year's methodological changes. Rising NEIG price growth is consistent with the projected effects of measurement changes introduced by the CSO earlier this year, as detailed in Box D of QB1, with this component now contributing positively to inflation over the forecast horizon. Services inflation remains broadly in line with previous projections, at around 3.5 per cent throughout the forecast horizon. Underlying inflation measures have edged upwards, remaining above pre-pandemic levels (Figure 27).
Energy prices and services remain the main drivers of projected 2026 inflation
Figure 26: Year-on-year percent change (p.p)
Source: CSO and Central Bank of Ireland. Chart data in accessible format (XLSX 176.07KB).
Underlying inflation measures experience modest upward pressure in 2026, continuing to exceed pre-pandemic level
Figure 27: Year-on-year percent change (%)
Source: Eurostat, Central Bank of Ireland calculations.
Note: Trend Inflation Model stands for unobserved components model with stochastic volatility. Chart data in accessible format. (XLSX 176.07KB)
Table 2: Inflation Projections
| Indicator | 2025 | 2026 | 2027 | 2028 |
|---|
| HICP | 2.1 | 3.4 | 3.1 | 2.0 |
| Goods | 1.0 | 3.2 | 2.6 | 0.2 |
| Energy | -0.3 | 10.3 | 5.8 | -1.5 |
| Food | 3.7 | 1.4 | 1.4 | 1.4 |
| Non-Energy Industrial Goods | -0.4 | 1.5 | 2.1 | 0.0 |
| Services | 3.0 | 3.5 | 3.5 | 3.6 |
| HICP ex Energy | 2.3 | 2.7 | 2.8 | 2.3 |
| HICP ex Food & Energy (Core) | 2.0 | 2.9 | 3.1 | 2.5 |
Source: CSO, Central Bank of Ireland.
Technical assumptions underlying the inflation forecasts have been revised since the previous Bulletin, with oil price projections revised down while wholesale electricity prices have been revised up significantly. The assumed path for oil prices has been revised down by 5.8 per cent on average through 2028. Conversely, wholesale electricity price assumptions have been revised up significantly by 21.7 per cent for 2026, 15.3 per cent for 2027, and 7.4 per cent for 2028. Natural gas price assumptions have also been revised upwards. DG-Agri food price assumptions were revised lower by 3.3 per cent in 2026, 6.3 per cent in 2027 and 7.2 per cent in 2028 with respect to the previous Bulletin. Exchange rate assumptions with respect to the USD and GBP are close to those used in the previous Bulletin (Table 3).
Table 3: Changes in key Technical Assumptions
| Indicator | QB3 2026 | QB2 2026 |
|---|
| 2025 | 2026 | 2027 | 2028 | 2025 | 2026 | 2027 | 2028 |
|---|
| Oil (USD/barrel) | 69.13 | 89.50 | 78.01 | 73.58 | 69.13 | 96.59 | 82.23 | 77.12 |
| Natural gas (EUR/MWh) | 36.25 | 50.96 | 43.31 | 30.33 | 36.25 | 45.62 | 37.51 | 27.87 |
| Wholesale electricity (EUR/MWh) | 83.62 | 108.70 | 90.17 | 73.09 | 83.63 | 89.30 | 78.19 | 68.06 |
| Non-energy commodities (USD, per cent change*) | 5.80 | 3.53 | 3.00 | -0.07 | 5.80 | 3.02 | 0.85 | -1.94 |
| EUR/USD | 1.13 | 1.16 | 1.16 | 1.16 | 1.13 | 1.17 | 1.17 | 1.17 |
| EUR/GBP | 0.86 | 0.86 | 0.86 | 0.86 | 0.86 | 0.87 | 0.87 | 0.87 |
Source: ECB, Refinitiv.
Notes: *Annual percent change. Cut-off date: August 20th.
Labour Market and Earnings
Although employment recovered in the second quarter, growth for 2026 as a whole is projected to remain below rates observed in recent years. This reflects subdued employment growth during the first half of the year, particularly in the first quarter, and a continuing moderation in labour demand based on high-frequency indicators. Employment is forecast to grow by 1.2 per cent this year, unchanged from the previous Bulletin, before rising to 2.1 per cent in 2027, partly reflecting favourable base effects from the weak outturn in 2026. A divergence persists between survey-based employment developments and other administrative labour market indicators, adding uncertainty to the assessment of current conditions. The unemployment outlook remains broadly unchanged from the previous Bulletin with a slight rise in the average annual unemployment rate projected for 2026 to 5.1 per cent, with a rate of 5.2 per cent forecast for 2028. Annual National Accounts revisions resulted in upward adjustments to income across several years. Nominal wage growth is projected to moderate over the forecast horizon as labour market tightness is forecast to continue to ease gradually.
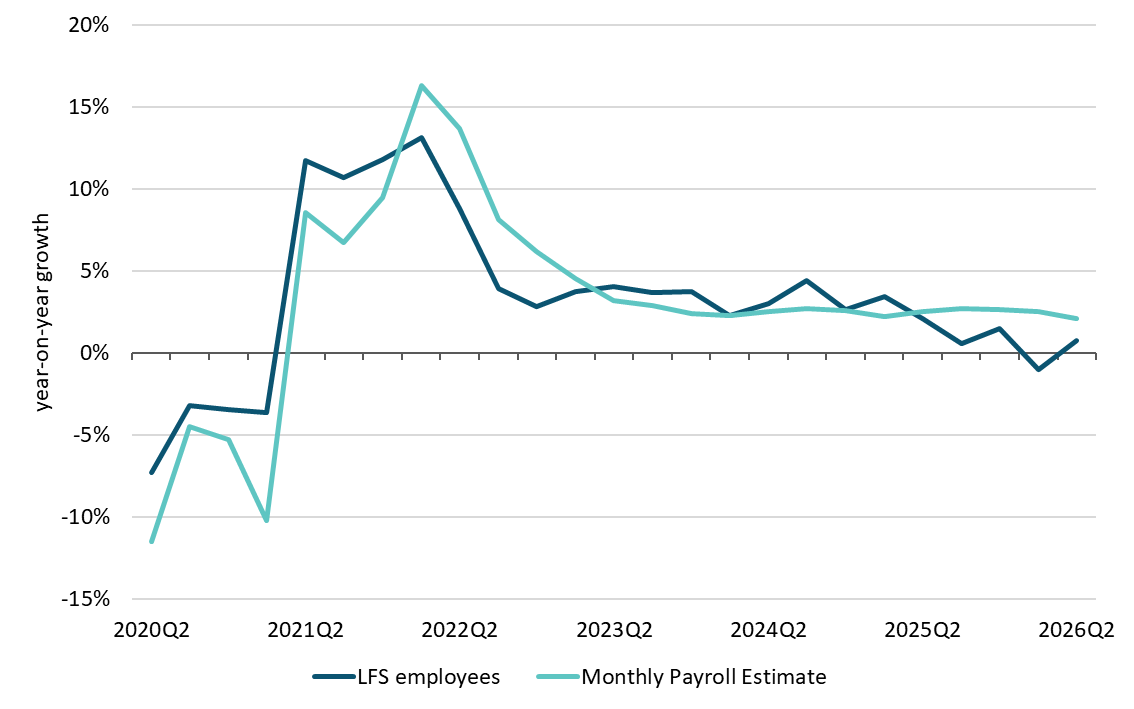
The Q2 2026 Labour Force Survey shows 0.8 per cent year-on-year growth in employment. The benchmark survey-based measure of employment growth is lower than that of other labour market indicators, with monthly administrative payroll data giving 2.1 per cent annual growth in Q2 2026 (Figure 28). Other indicators point to stronger labour market conditions compared to 2025 with cumulative employment permits for the year to August up 33.2 per cent and cumulative income tax receipts 7.7 per cent higher in nominal terms over the same period. The increase in employment permits is mainly driven by the Health and Industry sectors, which collectively account for 44 per cent of the net increase.
LFS data show positive employee growth though at a lower rate than admin data
Figure 28: Year-on-year growth in employee levels
Source: CSO; LFS and Monthly Payroll. Chart data in accessible format (XLSX 176.07KB).
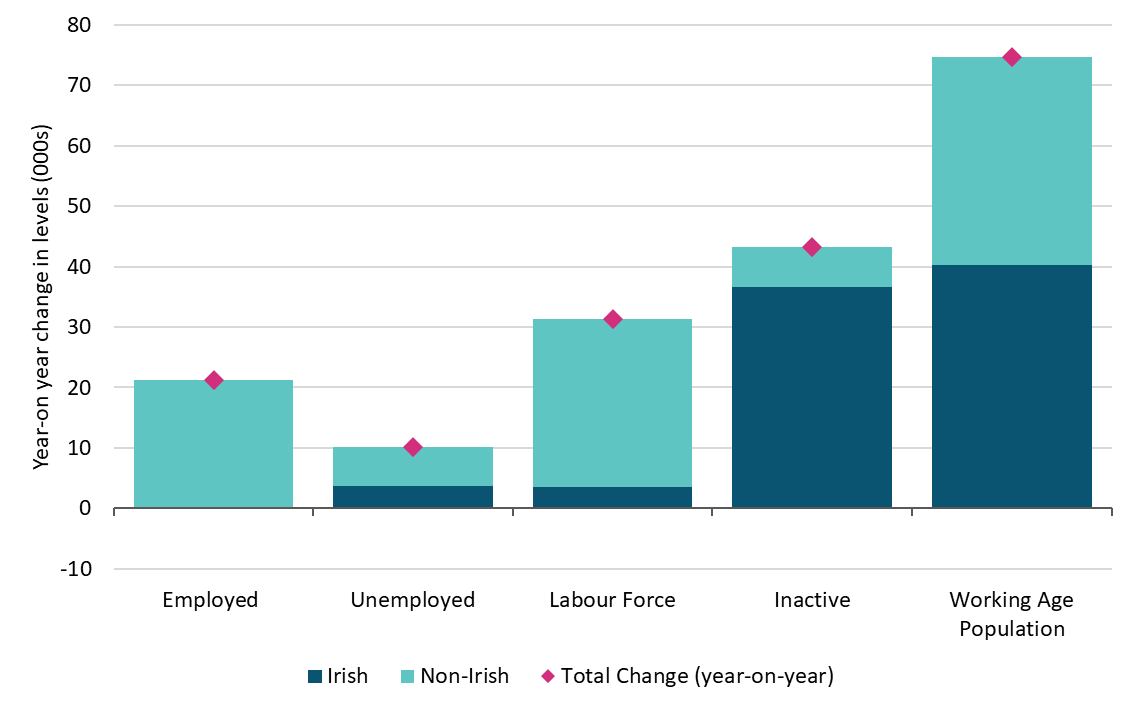
Eight of the 14 NACE sectors show year-on-year growth in employment in Q2 2026 with the remainder experiencing decreases. The largest increases were in Transport (+7.2 per cent) and Education (+6 per cent), while the steepest declines were in Professional services (-8.6 per cent) and Agriculture (-3.6 per cent). The ICT sector contracted by 1.2 per cent year-on-year amidst redundancy announcements across several large firms. Employment in the sector has declined since 2024, owing primarily to a reduction in computer programming roles as observed at the NACE 2-digit level. The rise in economy-wide employment levels has not been matched by an increase in labour market utilisation as both the employment rate and labour force participation rate have declined by 0.4 percentage points to 74.3 per cent and 66 per cent, respectively. Non-Irish workers accounted for all the net increase in year-on-year employment in Q2 2026, with employment levels of Irish workers declining by 0.5 per cent (Figure 29). This continues a trend in recent years in which non-Irish workers have accounted for most of the expansion in aggregate employment.
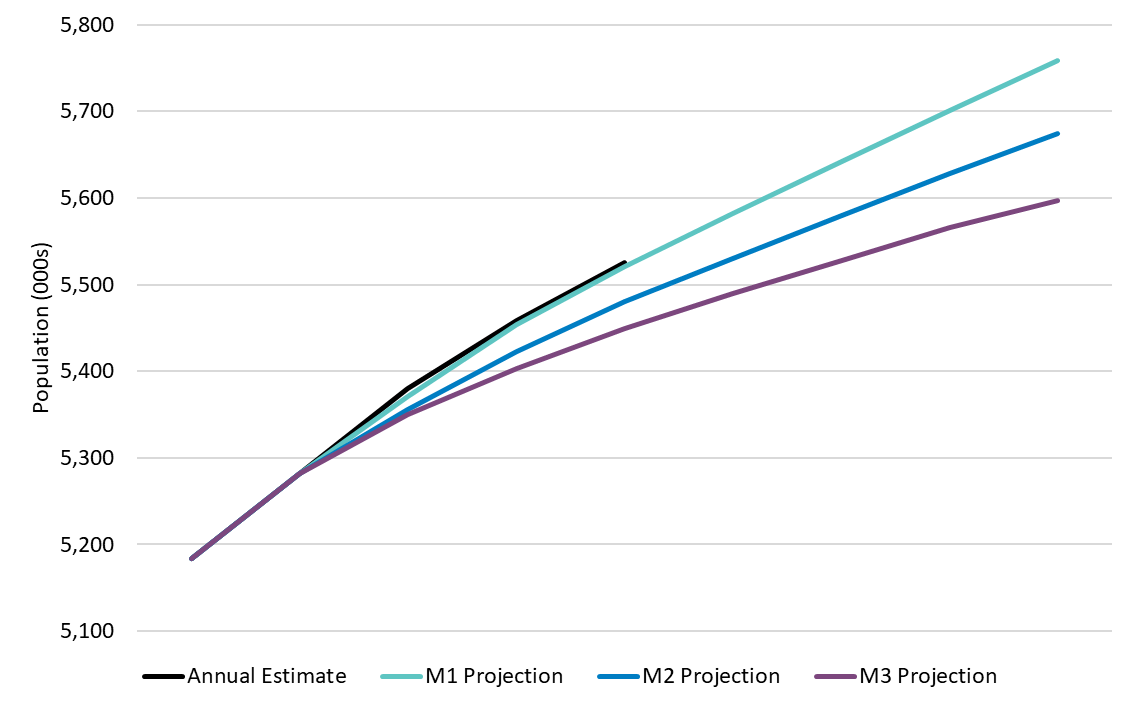
The population increased by 1.2 per cent in the twelve months to April 2026. Annual CSO population and migration estimates showed a 66,900 person rise in the population to 5.53 million with net inward migration contributing most of this growth (+48,100). Net migration is down from 59,700 persons in the year to April 2025, though this moderation is in line with CSO long-term projections with overall population growth currently tracking the high net migration scenario (M1) (Figure 30). The population already exceeds the central scenario (M2) by 0.8 per cent (45,500 persons).
Non-Irish persons accounted for the growth in year-on-year net employment in Q2 2026
Figure 29: Year-on-year change in labour market status (Q2 2026)
Source: CSO; LFS. Chart data in accessible format. (XLSX 176.07KB)
Population growth is increasing in line with the high net migration scenario
Figure 30: Annual population estimates and CSO long-run growth scenarios
Source: CSO. Chart data in accessible format (XLSX 176.07KB).
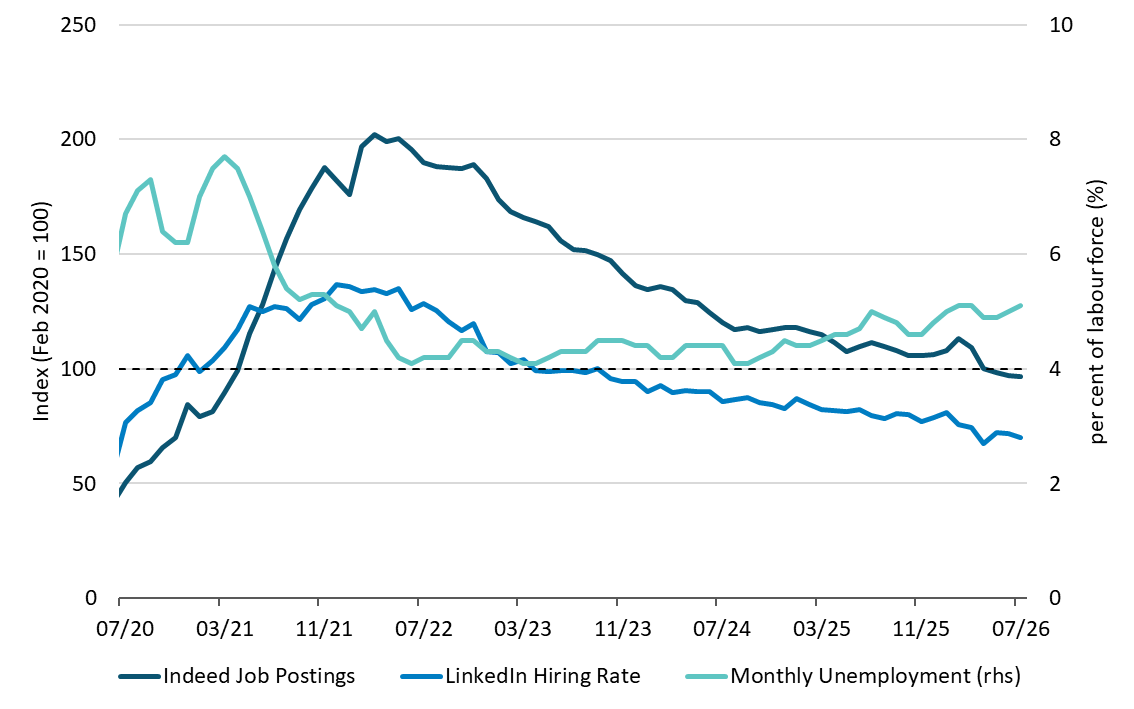
The ILO unemployment rate for persons aged 15-74 years increased to 5.1 per cent in Q2 2026, up from 4.9 per cent a year earlier. The number of unemployed persons rose by 10,100 since Q2 2025 to 150,900 persons. Higher-frequency indicators, including the monthly unemployment rate, have shown a gradual increase in unemployment over the last two years. These developments are consistent with a moderation in labour demand and mobility, with Indeed Job postings for July down 13.6 per cent relative to a year earlier (falling below the pre-pandemic baseline) and the LinkedIn hiring rate for Ireland following a broadly similar trajectory (Figure 31). Looking ahead, the unemployment rate is projected to average 5.1 per cent this year before slowly increasing to 5.2 per cent in 2028.
Labour demand and mobility are moderating
Figure 31: High-frequency labour market indicators (lhs: index - Feb. 2020 = 100 | rhs: %)
Source: CSO, Indeed and LinkedIn. Chart data in accessible format (XLSX 176.07KB).
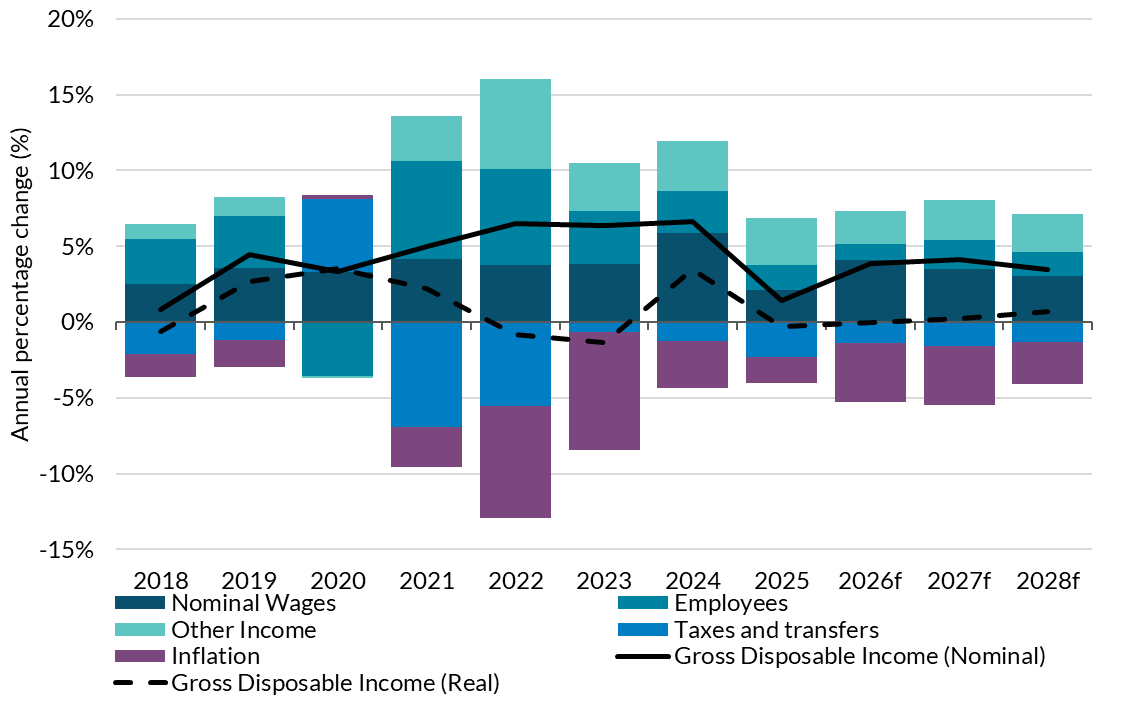
Revisions to Compensation of Employees in the Annual National Accounts, released in July, have resulted in upward adjustments to nominal wages backdated to 2021. Nominal growth in compensation per employee in 2024 was revised up to 6.6 per cent (3.3 per cent in real terms). This base effect then contributed to a lower growth rate of 2.4 per cent (0.7 per cent in real terms) in 2025. Overall, average real CPE for 2025 is now 4.6 per cent above the initial CSO estimate and 2.5 per cent higher than its pre-pandemic (2019) level. These upward revisions to compensation, in addition to amendments to taxes and transfers, have resulted in higher gross disposable income (GDI) per household. In the revised data, real GDI for 2025 is now 6.4 per cent higher compared to the initial estimate and real GDI in 2025 is 6.8 per cent above its 2019 level.
Wages and incomes are projected to grow over the forecast horizon, consistent with the expected growth in economic activity. The Public Service Agreement 2024-2026 expired in June with no successor deal in place to determine the scale or duration of future public sector pay increases, adding some uncertainty to the outlook for overall wage growth. Revisions to real wages and incomes indicate that both have moved above their 2019 levels, which may alleviate wage pressures to an extent, although this is also dependent on the future path of inflation. Recent QNA data indicate that nominal CPE increased by an average of 6.1 per cent in the first half of the year compared to 2025, equivalent to a 2.5 per cent increase in real terms. This, however, partly reflects compositional changes in the wage bill due to weaker employment levels in relatively lower-earning sectors such as Retail and Accommodation. Lower aggregate wage growth is projected for the remainder of this year amid moderating labour demand. Nominal CPE continues to recover from the weak outturn in 2025 with nominal CPE forecast to average 4.7 per cent growth in 2026 before slowing to 3.8 per cent and 3.5 per cent in 2027 and 2028, respectively. Real CPE growth is forecast to average 0.5 per cent per year over the forecast horizon with real GDI per household averaging 0.3 per cent per year (Figure 32). Looking ahead, while earnings growth is projected to remain positive in real terms, further reductions in labour market mobility, together with a modest rise in unemployment, are likely to weigh on worker wage bargaining power and may limit pressure on wage growth. Upside developments to GDI may occur in the event of changes to taxation bands in Budget 2027.
Decline in real gross disposable income in 2026 followed by pick up in 2027 and 2028
Figure 32: Year-on-year growth in gross disposable income per household and underlying components (p.p)
Source: CSO. Chart data in accessible format (XLSX 176.07KB).
Table 4: Labour Market Forecasts
| Indicator | 2025 | 2026f | 2027f | 2028f |
|---|
| Employment (000s) | 2,818 | 2,852 | 2,911 | 2,962 |
| % change | 2.2 | 1.2 | 2.1 | 1.8 |
| Labour Force (000s) | 2,955 | 3,004 | 3,068 | 3,124 |
| % change | 2.6 | 1.7 | 2.2 | 1.8 |
| Participation Rate (% of Working Age Population) | 66.1 | 66.1 | 66.4 | 66.5 |
| Unemployment (000s) | 137 | 152 | 158 | 162 |
| Unemployment (% of Labour Force) | 4.6 | 5.1 | 5.1 | 5.2 |
Public Finances
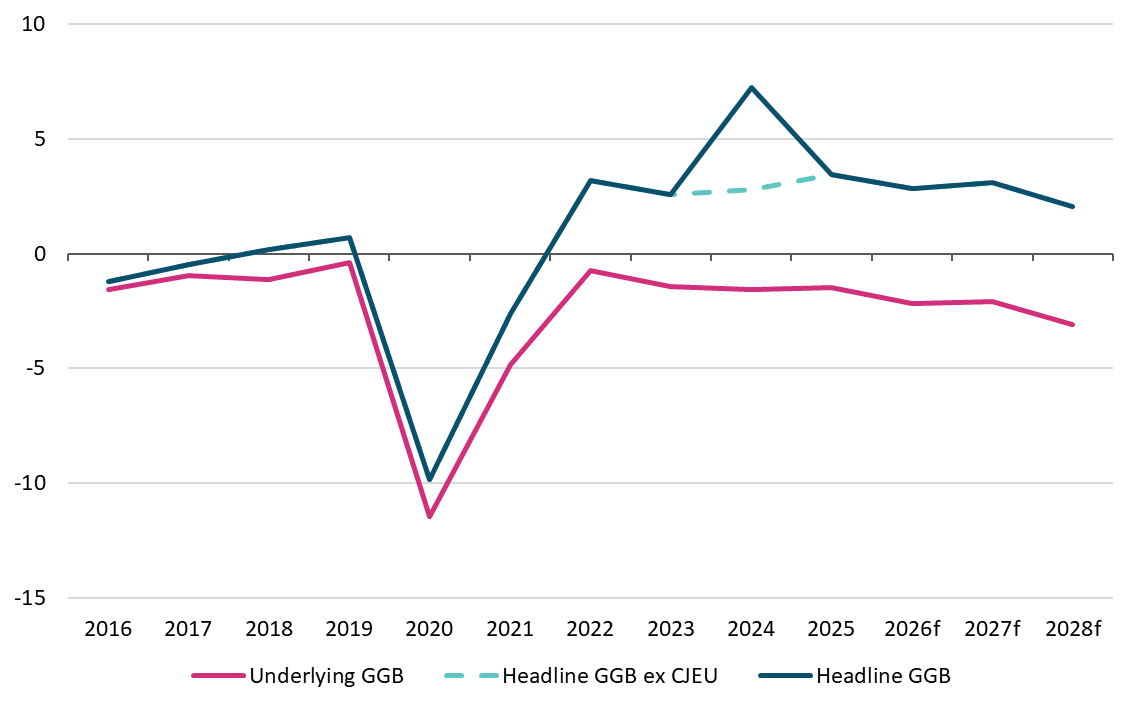
The underlying budget deficit, which excludes estimated windfall corporation tax (CT) receipts, is projected to deteriorate over the forecast horizon, as expenditure growth is forecast to exceed that of revenue. Average annual spending growth of 7.3 per cent is forecast over 2026 to 2028 while, in underlying terms, revenue growth is expected to average 5.9 per cent per annum over the same period. Consequently, the underlying budget deficit is projected to deteriorate from 1.5 cent of GNI in 2025 to 3.1 per cent in 2028 (Table 5). This outlook is broadly consistent with that in the June Quarterly Bulletin. The headline budget balance is projected to remain in surplus but to be lower at the end of the forecast horizon (Figure 33), falling from 3.4 per cent of GNI in 2025 to 2.1 per cent of GNI* in 2028.
Table 5: Key Fiscal Indicators, 2025-2028
| Indicator | 2025 | 2026(f) | 2027(f) | 2028(f) |
|---|
| GG Balance (€bn) | 11.5 | 10.1 | 11.8 | 8.3 |
| GG Balance (% GNI*) | 3.4 | 2.8 | 3.1 | 2.1 |
| GG Balance (% GDP) | 1.9 | 1.7 | 1.8 | 1.2 |
| GG Debt (€bn) | 209.9 | 207.1 | 206.2 | 210.9 |
| GG Debt (% GNI*) | 62.9 | 58.1 | 54.3 | 52.5 |
| GG Debt (% GDP) | 34.8 | 34.1 | 31.7 | 30.4 |
| Estimated Windfall CT (€bn) | 16.5 | 17.9 | 19.6 | 20.8 |
| Underlying GGB (€bn) | -5.0 | -7.8 | -7.9 | -12.5 |
| Underlying GGB (% GNI*) | -1.5 | -2.2 | -2.2 | -3.1 |
Source: Central Bank of Ireland projections.
Note: GG indicates General Government. Underlying GGB excludes estimates of excess CT and receipts from the Apple state aid case; (f) is forecast.
A deterioration in the underlying GG deficit is projected over the forecast horizon
Figure 33: per cent of GNI*
Source: CSO and Central Bank of Ireland.
Note: Underlying GGB excludes Central Bank estimates of excess corporation tax receipts and receipts from Apple State aid case; CJEU is Court of Justice of EU ruling on Apple state aid case. Chart data in accessible format (XLSX 176.07KB).
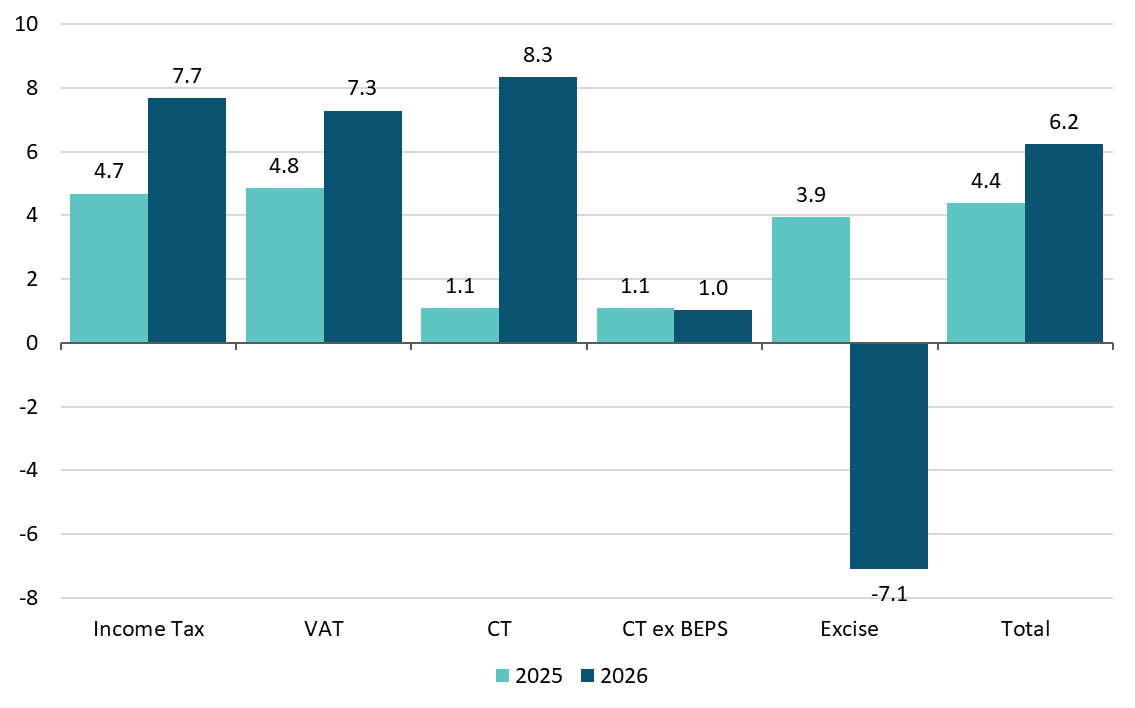
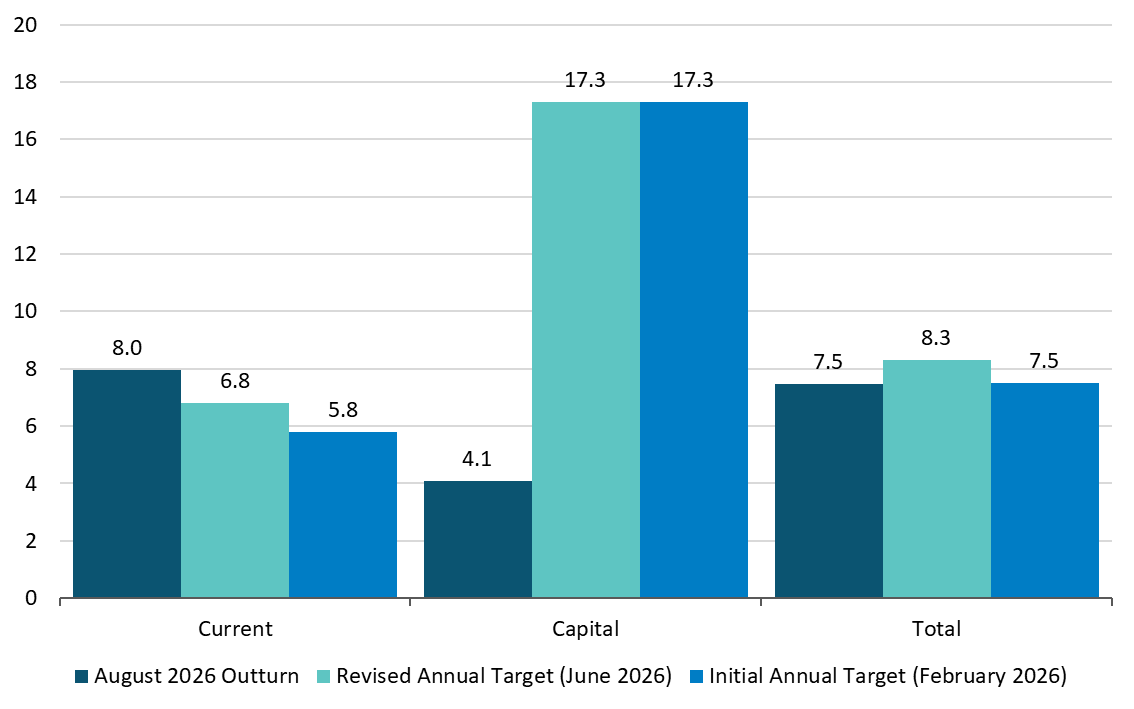
Tax revenue growth has been strong so far in 2026, while current government expenditure is increasing at a faster pace than was anticipated at the beginning of the year. Exchequer data for the first eight months of 2026 show year-on-year growth in income tax of 7.7 per cent and of 7.3 per cent in VAT over the same period in 2025. Cumulative corporation tax (CT) revenue, exclusive of receipts linked to the Apple State aid case, is 8.3 per cent above the level for the same period last year. This increase is supported by €1.2bn in supplementary receipts related to the introduction of the Minimum Tax Directive. Excluding the latter, growth in CT receipts were broadly flat on a year-on-year basis (Figure 34). Revenue from excise duties has declined over the year, reflecting lower monthly collections since fuel excise reductions were implemented in March, in response to the US-Iran conflict. The planned restoration in this duty, due to begin in September, has been paused by the Government. Total gross cumulative voted spending was 7.5 per cent higher in the year to August, broadly consistent with the annual rate of increase targeted in Budget 2026. Current expenditure is increasing at a faster pace than was expected at the beginning of the year, however, and the 2026 current expenditure ceiling has been revised up by €900m since the first quarter (Figure 35). In July, the Government published its Summer Economic Statement. This indicates that a €8.5bn fiscal package, encompassing €1.5bn of tax measures and €7bn of spending measures, will be introduced in Budget 2027, with the projected total expenditure ceiling for next year unchanged from the level set in the April Annual Progress Report. The factors that pose a risk to the public finances are discussed in further detail in the Balance of Risks below.
Tax revenue growth has been strong in the first eight months of 2026
Figure 34: per cent change
Source: Department of Finance, Central Bank of Ireland calculations. Chart data in accessible format (XLSX 176.07KB).
The current expenditure ceiling for 2026 has been revised up since the beginning of the year
Figure 35: per cent change
Source: Department of Finance Fiscal Monitor.
Note: Chart shows actual annual expenditure growth for year to August 2026 (green), alongside original target set out in February's Fiscal Monitor (light blue) and the revised target published in the June 2026 Fiscal Monitor (dark blue). Chart data in accessible format (XLSX 176.07KB).
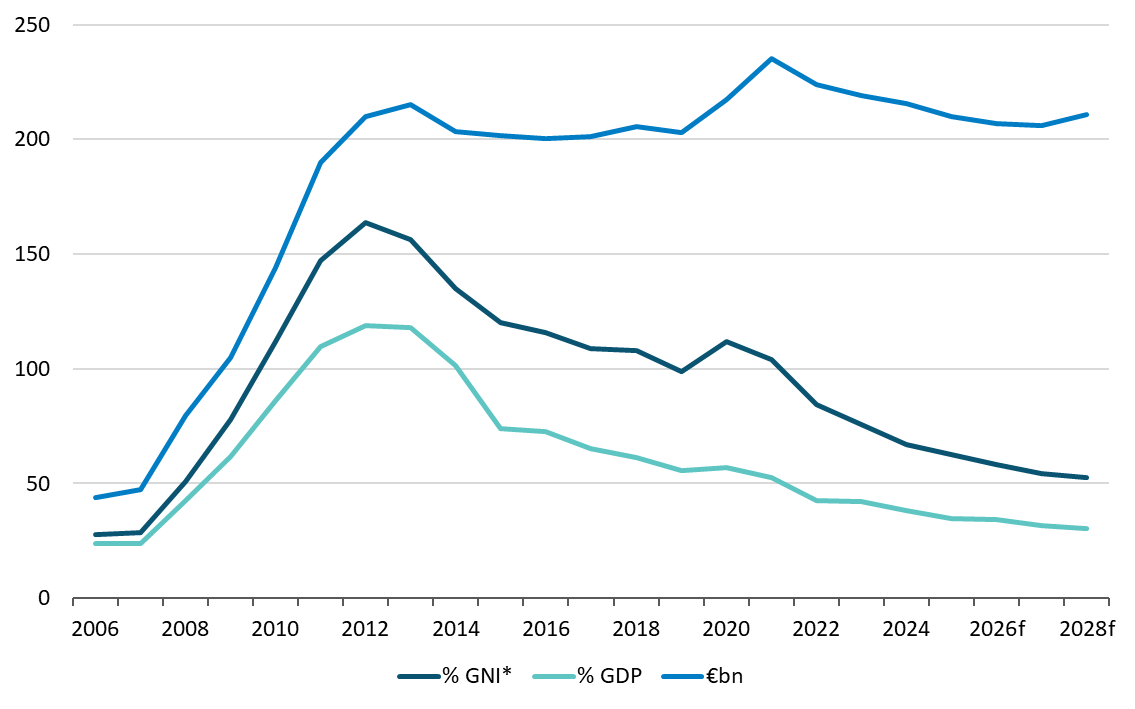
The General Government debt (GGD)-to-GNI* ratio is projected to fall over the projection horizon. The debt ratio is expected to decrease from 62.9 per cent of GNI* in 2025 to 52.5 per cent in 2028 (Figure 36). This improvement reflects a combination of projected headline primary surpluses (averaging 3.7 per cent of GNI* over 2026-2028) and a continuing favourable interest rate-growth rate differential. The latter is expected to narrow from the very favourable rates that occurred in recent years, however, as tighter financing conditions are projected to raise annual interest costs on public debt from around €3bn in 2025 to just over €6bn in 2030. The National Treasury Management Agency (NTMA) has raised €10.9bn through bonds sales in the year to date, bringing the State's total funding to the lower bound of its target for the year (€10-14bn). Ireland retains large liquid cash balances (partly reflecting receipts from the Apple state aid case) of €25.1bn at end of Q2. This balance is expected to remain broadly unchanged to end-year.
General Government debt ratio is projected to decline to close to 50 per cent of GNI*
Figure 36: per cent of GNI*, per cent of GDP, €billion
Source: CSO and Central Bank of Ireland. Chart data in accessible format (XLSX 176.07KB).
Balance of Risks to the Outlook
Risks to the overall outlook for economic growth are now broadly balanced. This assessment reflects downside risks due to energy price developments and geopolitical tensions in the Middle East offset by upside risks to modified investment and private consumption based on the implied momentum from recent outturns. Geopolitical tensions in the Middle East remain elevated, sustaining upward pressure on energy prices. If the war persists or escalates, the resulting higher inflation would directly reduce economic activity in Ireland by lowering real incomes and increasing input costs for firms. Higher global commodity prices would reduce economic activity in Ireland's main trading partners through the same channels, thereby lowering external demand for the traded sector of the economy. The decline in exports and activity in this sector would, over time, spill over to investment and the broader domestic economy, further reducing MDD and contributing to a decline in overall output, relative to the baseline projection. Other downside risks stem from export concentration in pharmaceuticals and ICT sectors and more prolonged infrastructure constraints limiting housing output and activity in other parts of the economy. Upside risks to growth arise from the potential for even stronger-than-expected AI capital expenditure, though this component is characterised by high volatility. Private consumption could also surprise to the upside, given the strong momentum implied by the outturns in the first half of 2026, as well as positive signals from high-frequency indicators.
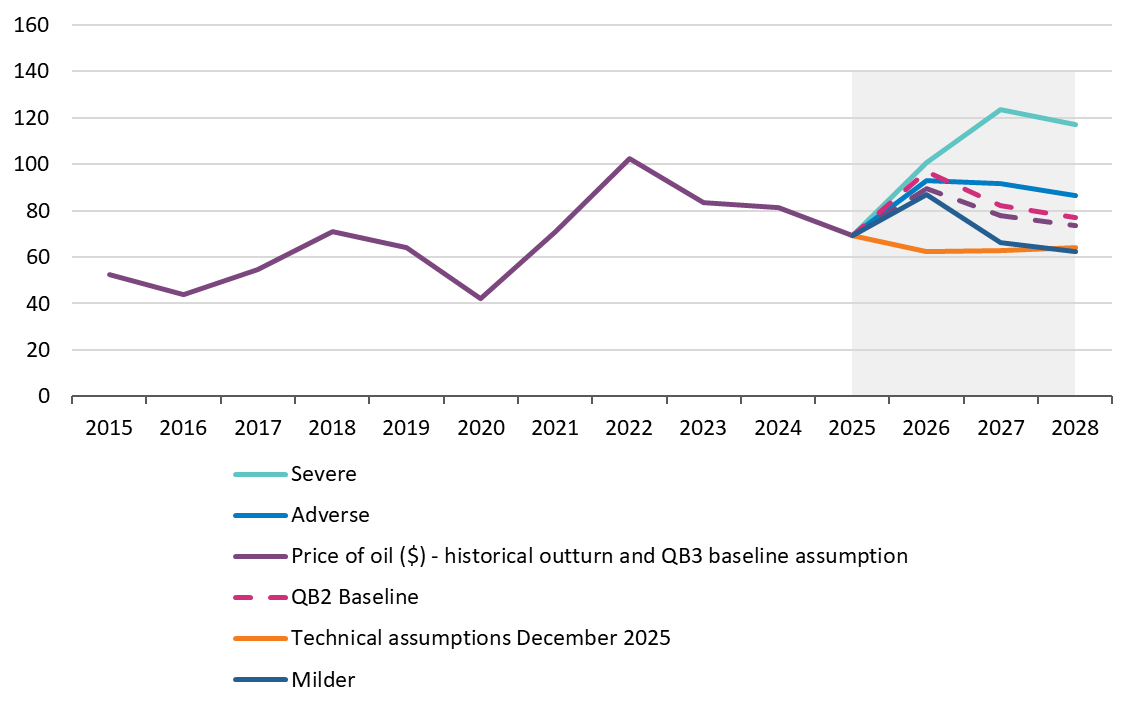
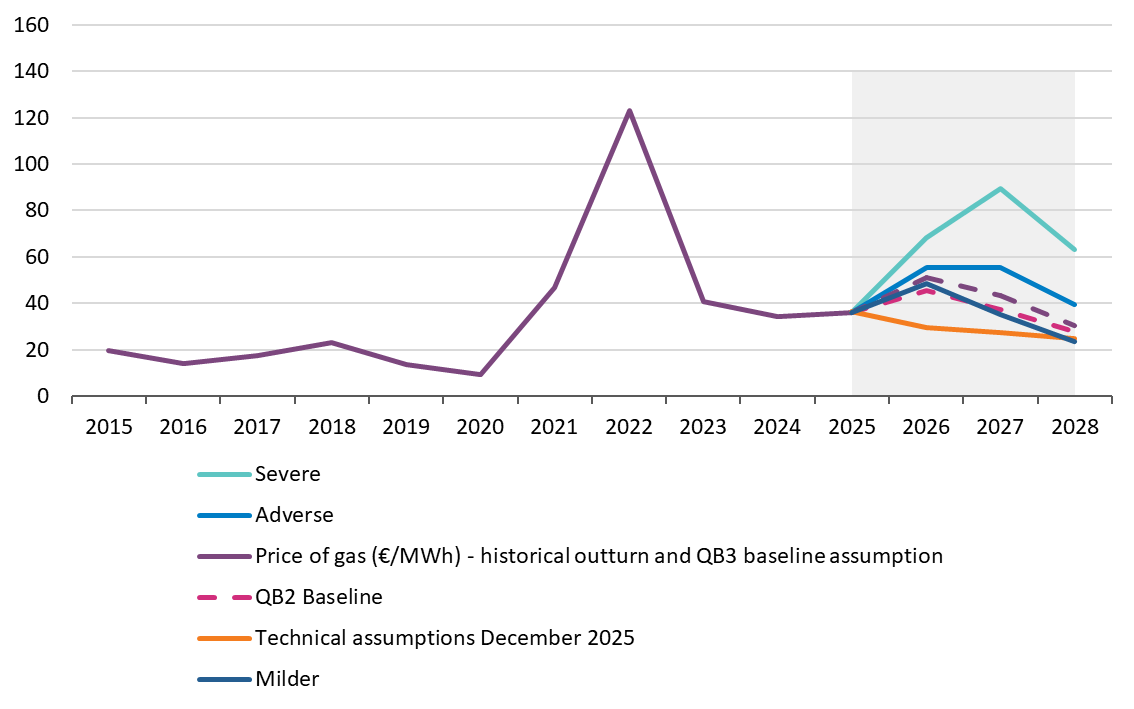
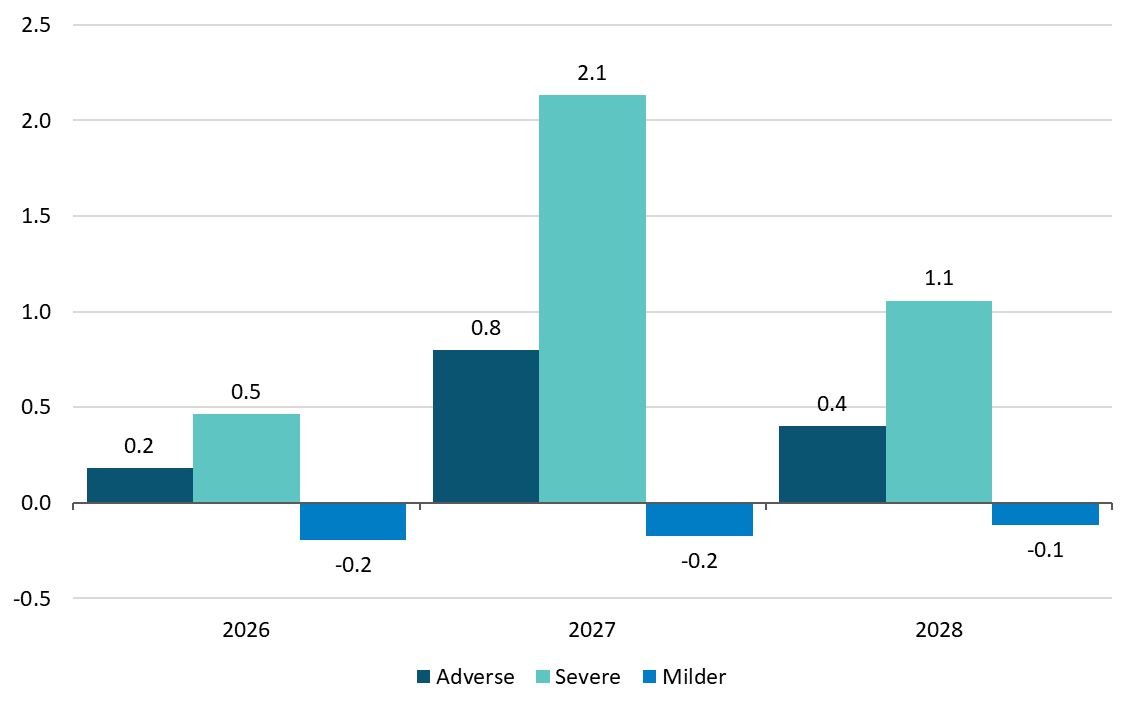
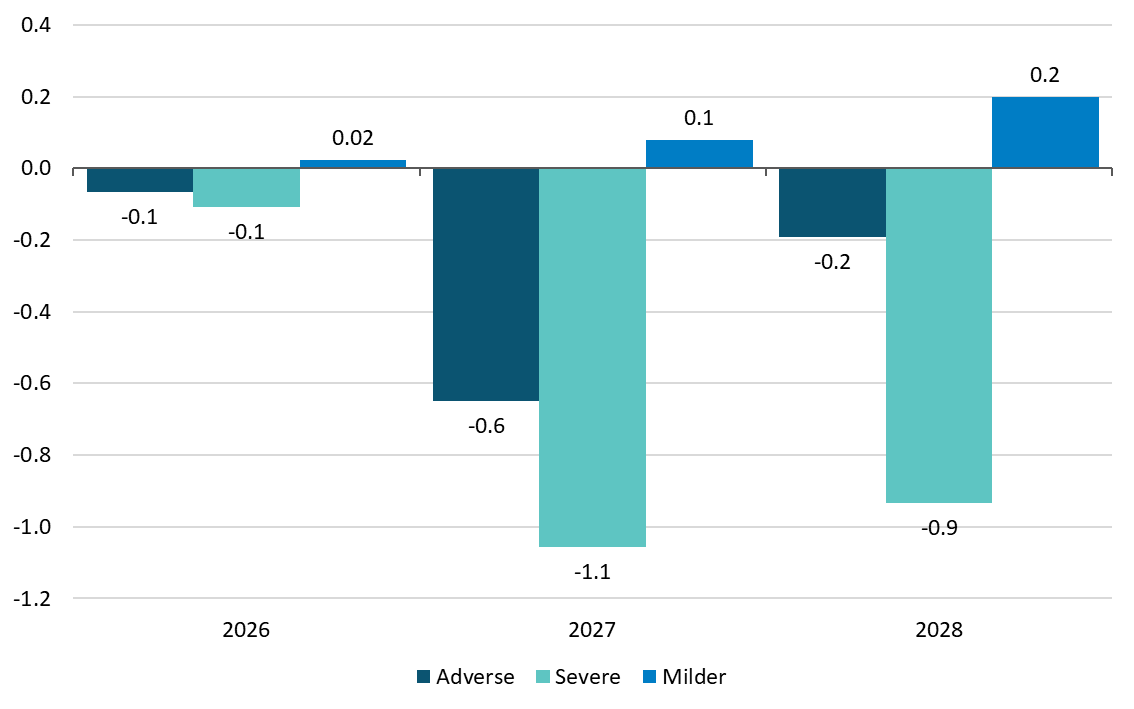
Depending on the state of geopolitical tensions in the Middle East, energy prices could be higher than assumed in the central forecast. The balance of risks to the inflation outlook is primarily tilted to the upside, stemming from the potential for a prolongation of geopolitical tensions in the Middle East. Given the uncertainty over the path of the conflict, we provide an update to the alternative stylised (severe, adverse, and milder) scenarios that were presented in our previous Quarterly Bulletin in June 2026. Figures 37 and 38 show the oil and gas price paths used for this update. In the severe scenario, oil and gas prices rise sharply above baseline and remain persistently elevated out to 2028, alongside a marked rise in global food prices. Figures 39 and 40 show the updated impact of each scenario on HICP inflation and MDD growth. The estimated impacts across all three scenarios are similar to those published in the previous Quarterly Bulletin. Under the severe scenario, HICP inflation would be 0.5 and 2.1 percentage points higher, and MDD growth 0.1 and 1.1 percentage points lower, in 2026 and 2027 respectively, relative to the baseline. Applying the estimated impacts from the severe scenario to the central forecasts, HICP inflation would stand at 3.9 per cent and 5.2 per cent in 2026 and 2027, respectively. MDD growth would be reduced to 3.7 per cent in 2026 and 2.3 per cent in 2027. For more detailed information on the scenario assumptions, transmission mechanisms and caveats, see ECB's September Staff Macroeconomic Projections (Box 4) and Quarterly Bulletin Q2.
Updated scenario assumptions related to the Middle East conflict
Figure 37: Oil prices (level), $ per barrel
Source: ECB. Chart data in accessible format (XLSX 176.07KB).
Figure 38: Gas prices (level), € per MWh
Source: ECB. Chart data in accessible format (XLSX 176.07KB).
Swift resolution of the Middle East war would benefit the economy but escalation would see higher inflation and weaker growth than in the baseline
Figure 39: Inflation, p.p. deviation from baseline
Source: Central Bank of Ireland. Chart data in accessible format (XLSX 176.07KB).
Figure 40: MDD growth, p.p. deviation from baseline
Source: Central Bank of Ireland. Chart data in accessible format (XLSX 176.07KB).
Risks to the non-energy components of inflation are also primarily tilted to the upside. Food inflation faces upside risk, as elevated input costs combined with the extreme weather events observed during 2026 could exert additional upward pressure on prices. Services inflation has remained highly persistent throughout 2026, continuing to add close to 2 percentage points to the headline rate, and there is a risk that this persistence continues for longer than projected in the baseline. Elevated energy costs could generate stronger-than-anticipated indirect effects and, coupled with potential second-round effects from wage adjustments, risk adding further upward pressure to prices and lengthening the persistence of this shock to headline inflation.
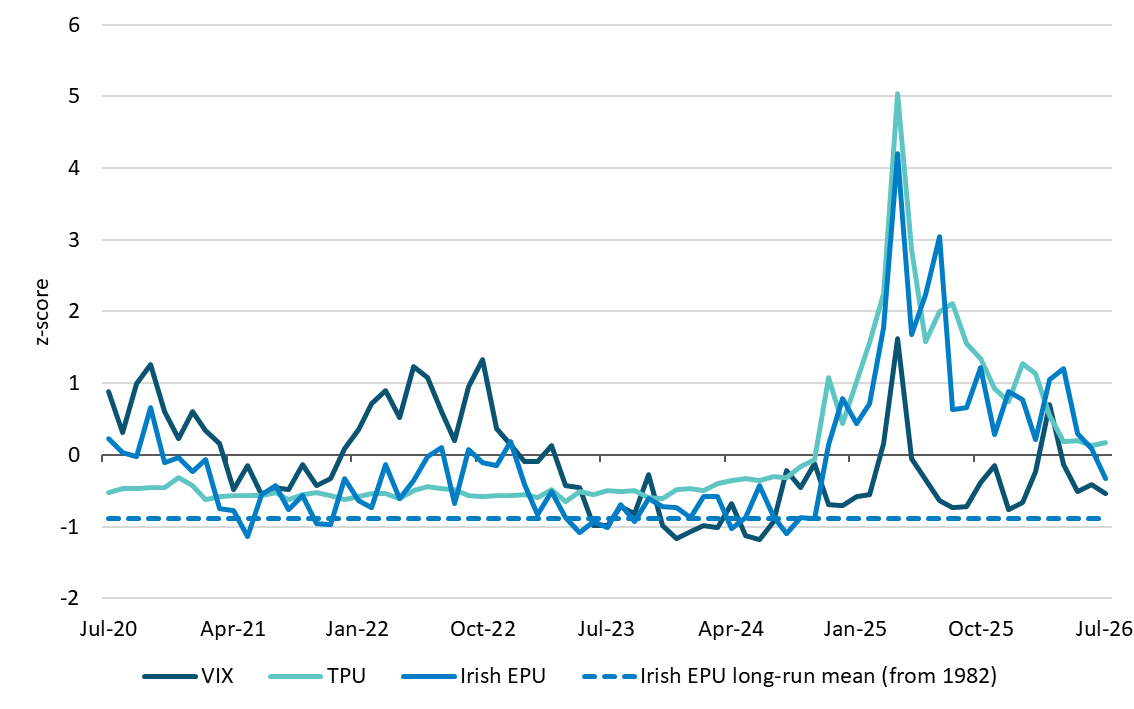
Measures of financial, trade and general policy uncertainty have declined in recent months, though trade and policy uncertainty remain above their historic averages
Figure 41: Standardised z-score
Source: Caldara et al. (2020); Rice (2023); CBOE.
Note: Monthly data to July 2026. Series standardised using their January 2020 -- July 2026 means and standard deviations. The dashed line shows the Irish EPU average since January 1982 on the same standardized scale. Chart data in accessible format. (XLSX 176.07KB)
The balance of risks to the export forecast is to the downside over the medium term given the high level of concentration in pharma and ICT exports, with the polypeptide hormone export cycle presenting both upside and downside risks. Despite the potential for continued low reported unit values in customs trade data, the baseline assumes that the volume of polypeptide hormone exports grows at moderate levels over the forecast horizon reflecting strong international demand for weight-loss drugs and that this will support growth in overall net trade. Consistent with the recent high level of volatility observed in recent CSO outturns for goods exports and GDP up to Q2 2026, the projections for these headline aggregates are associated with a wide degree of uncertainty at present and there is a risk that reported trade volumes in official data are weaker than projected in the baseline forecast. On the upside, if global demand for diabetes and obesity treatments continues to rise rapidly, pharma exports could grow faster than assumed in the baseline. In the short term, there is some upside risk to services exports from the presence of frontier AI firms in Ireland which could contribute to faster growth in computer services exports over the forecast horizon than projected in the baseline. Over the medium term, there are downside risks to Irish exports and corporation tax receipts if US MNEs actively reduce their activity in Ireland. Changes in US corporate tax or industrial policy could affect the location of intangible assets and production, with knock-on effects for goods and services trade, investment and corporation tax receipts. Moreover, the economy is vulnerable to firm or sector-specific shocks affecting the pharmaceutical or ICT sectors. Firms in the services sector differ from their counterparts in the manufacturing sector as the required sunk investments in Ireland tend to be lower. As a result, the activity and employment arising from the MNE-dominated parts of the services sector are likely to be more sensitive to negative shocks.
AI-related developments are likely to have a meaningful impact on the economy over both the short and medium term, though both the magnitude and nature of these changes are highly uncertain. Investment and import volatility related to AI and data centre hardware has been substantial, with the AI-related goods import basket reaching €7.7bn in Q2-2026, about a fifth above its Q4-2025 peak. Much of this investment is allied to a small number of large MNEs in the ICT sector. There are upside risks to M&E forecasts coming from a more substantial AI capital expenditure than incorporated in current projections, particularly if frontier AI firms continue to expand their Irish operations. On the downside, a correction in equity markets related to AI valuations could result in some pull back of capital spending in this sector. Such a correction would have implications for exports, investment, employment and tax revenue given the concentration of activity in a small number of firms. Over the medium term, AI developments present both productivity opportunities and labour market uncertainties. The low exposure of Irish households to direct holdings of bonds and equity assets suggests limited short-term wealth effects from financial market movements, whether positive or negative. However, the positioning of Ireland as a hub for AI-related infrastructure and services could provide longer-term benefits to competitiveness and growth, provided that enabling infrastructure keeps pace with demand.
Capacity constraints could worsen if progress on alleviating infrastructure gaps in the economy is delayed or inadequate. This risk could arise even if a slowdown in the pace of economic growth transpires. Planned expenditure under the National Development Plan is designed to address shortages of critical infrastructure in water and wastewater, energy, transport and housing. Reforms such as those in the Accelerating Infrastructure Report and Action Plan are designed to reduce delays in the delivery of large national infrastructure projects. For housing output to build on last year's outturn, improvements in the timing of infrastructure delivery is required, particularly water and metered electricity connections. While there have been over 100,000 housing commencements since 2024, the timing around housing and apartment delivery suggests that without further improvements in commencements and building time, current projections may be difficult to meet. Any further acceleration in input costs resulting from a prolonged war in the Middle East and associated increases in energy costs would present downside risks to the forecasts. Delayed progress resulting in persistent deficits in the provision of key infrastructure represents a downside risk to the projections for investment. If this materialised, lower investment would act as a drag on long-term growth and productivity. Over the short run, this could result in higher and more persistent inflation triggered by domestic pressures and, with competitiveness impaired, weaker economic growth occurring over the longer term. Domestic capacity constraints and inflationary pressures, and the associated negative implications for long-term growth, would be aggravated if the pattern of procyclical budgetary policy persists.
Government expenditure growth is running well in excess of the growth in tax revenue when excess corporation tax is excluded, presenting a material downside risk to the public finances. Annual spending growth is expected to average 7.3 per cent over 2026 to 2028, while annual growth in underlying revenue is expected to average 5.9 per cent over the same period. As a result, the underlying budget deficit is projected to deteriorate from 1.5 per cent of GNI* in 2025 to 3.1 per cent in 2028. Corporation tax receipts are highly concentrated, with two sectors accounting for over half of total CT revenue, and remain vulnerable to changes in US trade or taxation policy. CT is expected to continue to grow strongly but this projection is subject to significant uncertainty. The absence of an effective fiscal anchor in the context of rising underlying deficits presents risks to the sustainability of the public finances. In-year revisions to expenditure plans could further widen the underlying deficit if not matched by corresponding revenue measures. The concentration of CT receipts in a small number of firms means that any significant changes to the activities or tax arrangements of these firms could have material implications for the budget balance.
Detailed Forecast Table
| | 2024 | 2025e | 2026f | 2027f | 2028f |
|---|
Constant Prices | | | | | |
| Modified Domestic Demand | 1.8 | 4.7 | 3.8 | 3.4 | 3.3 |
| Modified Gross National Income (GNI*) | 6.4 | 4.7 | 3.1 | 3.1 | 3.2 |
| Gross Domestic Product | 3.6 | 8.0 | -1.4 | 4.3 | 4.3 |
| Final Consumer Expenditure | 2.4 | 2.5 | 2.1 | 2.2 | 2.1 |
| Public Consumption | 4.7 | 3.3 | 3.3 | 2.8 | 2.8 |
| Gross Fixed Capital Formation | -25.6 | 38.4 | 0.0 | 3.8 | 3.9 |
| Modified Gross Fixed Capital Formation | -2.3 | 11.3 | 7.8 | 6.2 | 6.2 |
| Exports of Goods and Services | 10.2 | 7.5 | 1.2 | 6.6 | 5.7 |
| Imports of Goods and Services | 4.8 | 9.6 | 5.2 | 6.4 | 5.3 |
| Total Employment | 2.7 | 2.2 | 1.2 | 2.1 | 1.8 |
| Unemployment Rate | 4.3 | 4.7 | 5.1 | 5.1 | 5.2 |
| Harmonised Index of Consumer Prices (HICP) | 1.3 | 2.1 | 3.4 | 3.1 | 2.0 |
| HICP Excluding Food and Energy (Core HICP) | 2.3 | 2.0 | 2.9 | 3.1 | 2.5 |
| Compensation per Employee | 6.6 | 2.4 | 4.7 | 3.8 | 3.5 |
| General Government Balance (% of GNI*) | 7.2 | 3.4 | 2.8 | 3.1 | 2.1 |
| ‘Underlying’ General Government Balance (% of GNI*) | -1.6 | -1.5 | -2.2 | -2.1 | -3.1 |
| General Government Gross Debt (% of GNI*) | 67.0 | 62.9 | 58.1 | 54.3 | 52.5 |
| Modified Investment (% of Nominal GNI*) | 20.0 | 21.9 | 22.7 | 23.1 | 23.7 |
Revisions from previous Quarterly Bulletin (percentage points) | | | | | |
| Modified Domestic Demand | 0.0 | -0.2 | 0.5 | 0.6 | 0.0 |
| Gross Domestic Product | 1.0 | -4.3 | 1.3 | -2.2 | 0.3 |
| HICP | 0.0 | 0.0 | -0.1 | 0.2 | 0.0 |
| Core HICP | 0.0 | 0.0 | -0.1 | 0.3 | 0.2 |
Quarterly Bulletin No. 3 2026: Boxes
The substantial presence of Multinational Enterprises (MNEs), combined with Ireland's role in global value chains, have distorted traditional measures of its economic activity. Measures such as Gross Domestic Product (GDP) and Gross National Income (GNI)
are largely detached from the underlying welfare of Irish residents. This poses problems since an understanding of underlying economic activity — i.e. the activity that is relevant for determining the employment and incomes of Irish residents
— is important for domestic policy making, including fiscal policy. The disconnect between headline and actual income levels in Ireland — which became stark following the 26 per cent growth recorded in Irish GDP in 2015 — has continued
with real GDP growth of 8 per cent in 2025. Measures of economic activity more closely related than GDP to the welfare of Irish residents, show that the economy continued to grow strongly in 2025, but at a pace substantially lower than indicated by
GDP (Figure 1). For the first half of 2026, GDP and the modified measures give entirely divergent signals, with GDP reported to have contracted by almost 7 per cent, while domestic indicators signal growth between 2 and 3.1 per cent.
Measures of economic growth
Figure 1: Annual growth in 2025 at constant prices
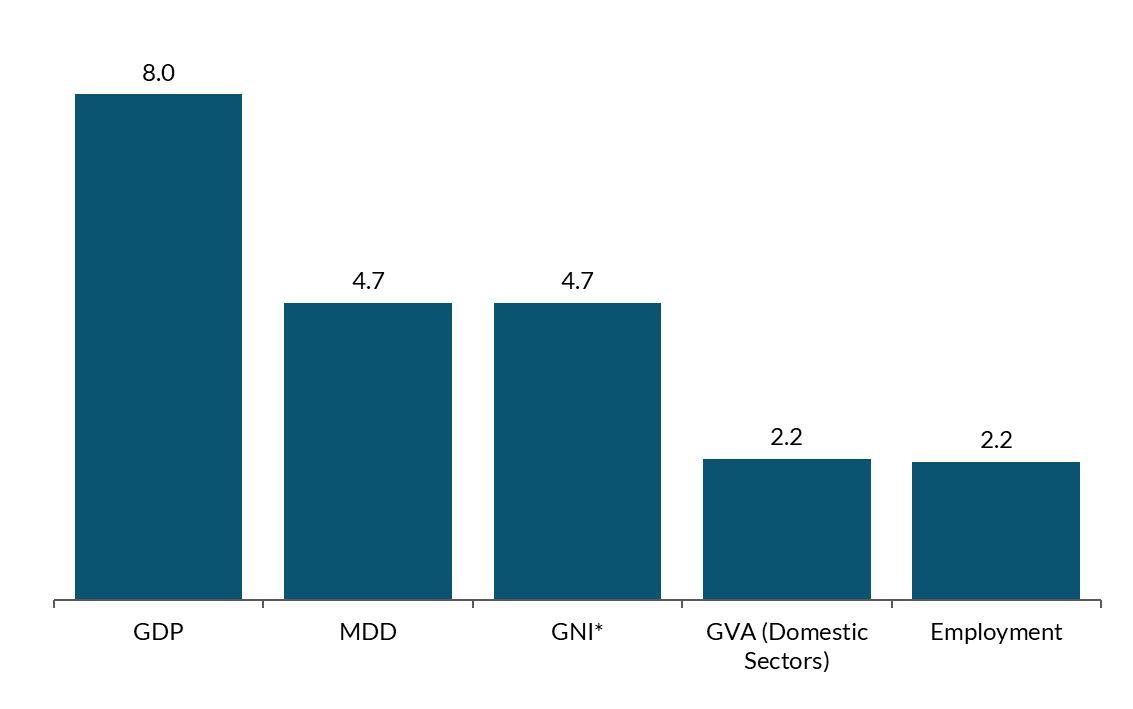
Source: CSO and authors' calculations.
Note: Figure shows 2025 YoY growth rate for each series using constant market prices.
Chart available in accessible format.
Reflecting the difficulty in interpreting standard National Accounts aggregates in an Irish context, since 2017, the CSO has published GNI* — a modified measure of national income more closely related to activity within the domestic economy than
either GDP or GNI. The derivation of GNI* for 2025 is shown in Figure 2. This waterfall diagram starts with reported Irish GDP in 2025 and removes several distortionary elements such as retained earnings of redomiciled PLCs, depreciation of R&D/IP
assets, and depreciation of aircraft owned by aircraft leasing companies located in Ireland. Once all MNE-related distortions have been removed, what remains constitutes compensation paid to employees working in Ireland, gross operating surplus and
gross mixed income of Irish-owned enterprises, the portion of foreign owned firms' gross operating surplus that is retained in Ireland and taxes received by government. These amounts are at the disposal of domestic sectors for spending and/or investment,
making GNI* a more accurate measure of activity within the domestic economy than either GNI or GDP.
The walk from GDP to GNI*
Figure 2: Net factor income and other adjustments used to derive GNI*
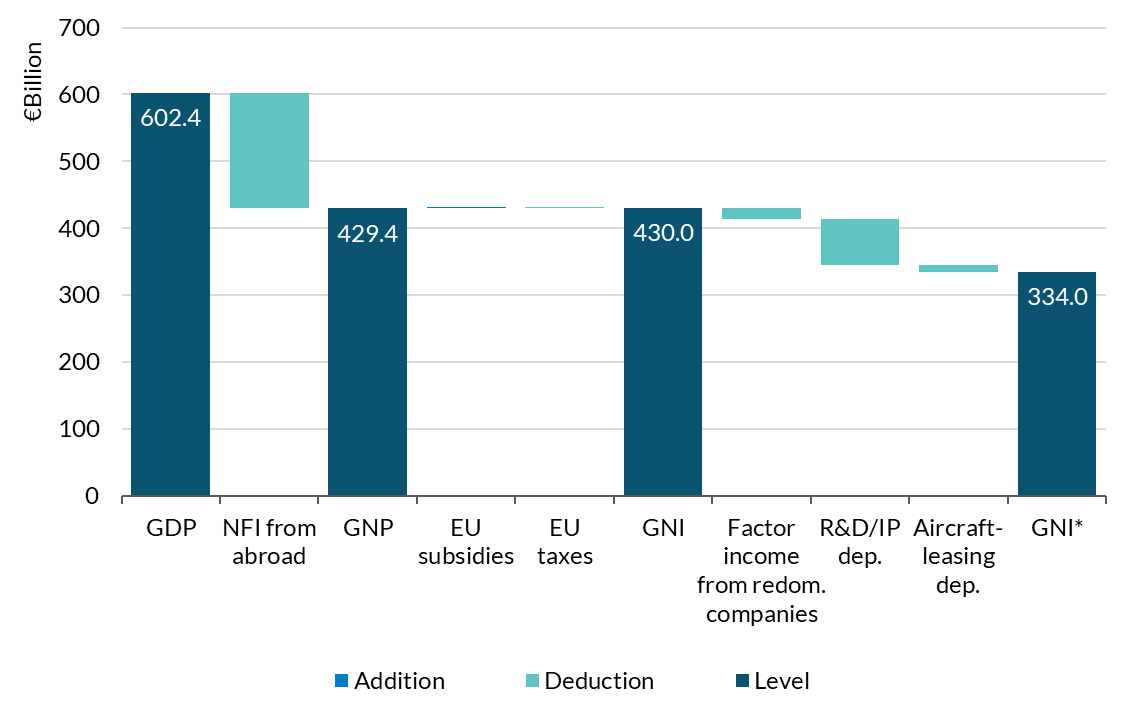
Source: CSO, authors' calculations.
Note: Current market prices, € billion.
Chart data in accessible format.
The production of GNI* by the CSO has proven useful as a measure of domestic economic activity in Ireland and it is widely used by analysts, however, the measure also has some shortcomings. Firstly, given that the top-down approach to calculating GNI*
is a subtraction of a number of items from headline GDP, rather than modifying the components of GDP and then aggregating, it is not possible to identify the contribution of specific sectors of the Irish economy to overall GNI* growth. This makes
it difficult to interpret the extent to which sectors are contributing most to the domestic Irish economy. Secondly, the top-down approach to GNI* presents forecasting challenges. This approach requires projections for a number of globalisation-related
adjustments such as aircraft leasing and depreciation of IP assets located in Ireland. These data series are characterised by high volatility and weak linkages to other variables in the domestic economy.
The approach in this Box constructs a bottom-up decomposition of GNI* using available data from the CSO and Revenue. It offers several analytical advantages over the official top-down methodology. First, it provides transparency regarding the
composition of national income, revealing that while GNI* primarily reflects the income of domestic sectors, wages and corporation tax paid by foreign-owned multinationals have become increasingly important. Secondly, it enables the decomposition
of GNI* by institutional sector, clarifying the contributions of households, government, domestic corporations, and foreign corporations to national income, thereby providing a more granular and economically interpretable understanding of Ireland's
national income than either headline GDP or the official top-down GNI* calculation alone.
Estimating GNI* from Income-Side Components
Building on the work by the Department of Finance and The Irish Fiscal Advisory Council, our approach to decomposing GNI*
employs a bottom-up income-based methodology. Starting from the institutional sector accounts maintained by the CSO, we aggregate labour income from domestic employers (comprising domestic household income from firms and government), domestic private
non-labour income (comprising domestic firms' profits, self-employment income, and investment returns) and government primary income (principally tax receipts net of subsidies) (see Table 1). To this domestic core, we add the labour income paid to
Irish households by foreign-controlled firms, and the income of these firms net of their repatriated profits, depreciation adjustments, and excluding the corporation taxes they pay, which we consider as a separate item. Finally, we adjust all components
for inflation using the published GNI* deflator.
Table 1: Data Sources and Methodology
| Item | Data Source(s) | Description | Table Code |
|---|
| Domestic labour | CSO ISA;
QNA | Resident compensation (compensation of employees) less MNE labour; includes government and NPISH employers. | ISQ01;
ISA03;
QNA Table 7.6 |
| MNE labour | CSO ISA;
QNA | Resident compensation (compensation of employees) allocated using the foreign-employer payroll share; QNA extends the 2024 ISA share into 2025. | ISQ01;
ISA03;
QNA Table 7.6 |
| Domestic private non-labour | CSO ISA | Household non-labour income plus domestic-owned corporate primary income; 2024 ownership shares used for 2025. | ISQ01;
ISA03 |
| Government primary income | CSO ISA | General-government gross balance of primary incomes, summed over four quarters. | ISQ01 |
| MNE corporation tax | CSO Government Finance; Revenue | Accrual corporation tax allocated using Revenue's foreign-owned MNE share; pre-2019 shares are based on Revenue approximations. | GFA03; Revenue CT reports |
| Other MNE-related income | CSO ISA; Annual National Accounts; Revenue | Foreign/redomiciled corporate primary income less published GNI* adjustments, less MNE corporation tax. | ISQ01;
ISA03;
NA001;
GFA03 |
| Unallocated sector | CSO ISA; Annual National Accounts | S.1N, the annual–quarterly GNI gap, and any remaining residual. | ISQ01;
NA001 |
| GNI* | CSO Annual National Accounts | Official nominal and real GNI* | NA001;
NA002 |
Source: CSO, authors' calculations.
Note: Data sources and methodology.
In Figure 3 we show the resulting decomposition of real GNI* in levels. The bottom-up approach reproduces the official estimate of real GNI* with a small residual. Domestic labour and other income sources account for the majority of real GNI* but the
contribution of MNEs (including MNE corporation tax, wages and other related income) has increased over time — from 16 per cent in 2014 to 26 per cent in 2025. The largest contributor to GNI* in 2025 was income of Irish households paid by domestic
firms which accounted for a third of the total. MNE corporation tax accounted for 9 per cent of GNI* in 2025, a substantial increase from 2.5 per cent in 2013, highlighting an increasing importance of taxes paid by multinationals.
MNE contributions to GNI* have increased since 2014
Figure 3: Decomposed GNI*, constant market prices (€ millions), 2014–2025
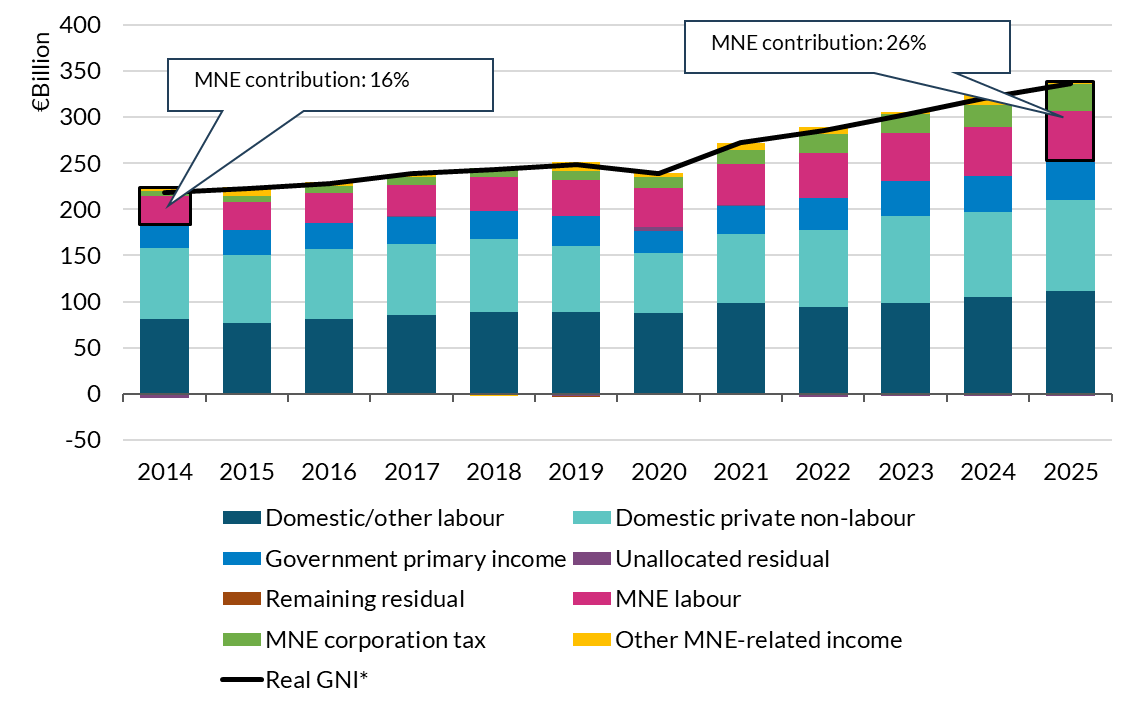
Source: CSO and authors' calculations.
Note: Constant market prices.
Chart data in accessible format.
Figure 4 shows the same decomposition of real GNI* but expressed in growth rates. GNI* has grown on average 5.5 per cent since 2022, compared to an average of 4.5 per cent since 2014. 2025 saw 4.7 per cent growth. From 2022 to 2025, real GNI* grew by
a cumulative 18.2 per cent, of which 6 percentage points came from labour income paid by domestic employers, 5.2 percentage points came from income received by domestic firms. Corporation tax paid by MNEs and Government primary income both contributed
2.8 percentage points each. Since 2022, CT from MNEs has added 1.2 percentage points per annum to annual average real GNI* growth; the equivalent figure from 2014 to 2019 was 0.4 percentage points per annum. The increased share of GNI* growth attributable
to corporation tax leaves the economy (and in turn the public finances) exposed in the event of a retrenchment in this sector.
GNI* has grown at an average of 4.5 per cent annually since 2014
Figure 4: Decomposition of GNI* growth rate, constant market prices, 2014–2025 and growth in contributors to cumulative GNI* growth from 2022 to 2025
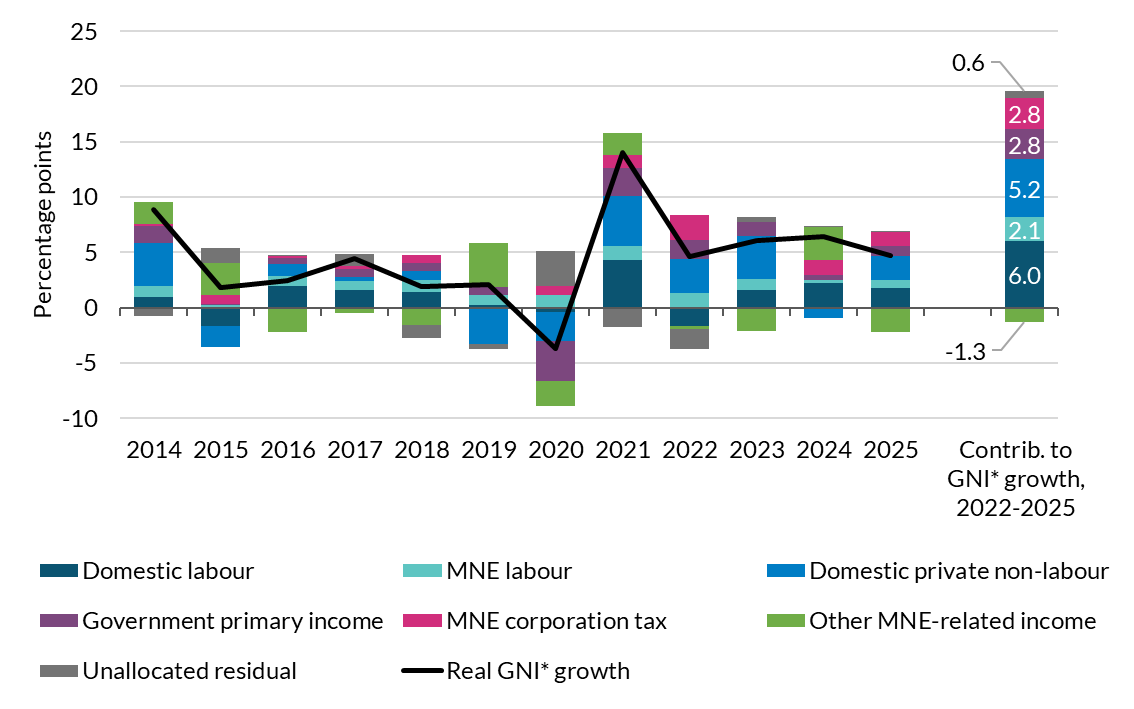
Source: CSO and authors' calculations.
Note: Constant market prices.
Chart data in accessible format.
Conclusion
The exercise in this Box shows that it is possible to derive an estimate of GNI* that closely matches the official data using detailed components of income published by the CSO. In this way the analysis provides a useful enhancement to the top-down official
estimate. With standard National Accounts aggregates such as GDP continuing to be disconnected from economic activity carried out in Ireland, further development of modified measures such as GNI* would help policymakers better understand the underlying
drivers of economic growth in Ireland.
Endnotes
Planning permissions are a closely watched leading indicator of housing supply but the link between permissions and completions has weakened over time. A consistent share of planning approvals does not get built — of the housing units granted planning
approval in each year from 2017 to 2020, around a quarter lapsed without construction commencing in the subsequent five years. The homes that are built now take longer to arrive. For homes completed so far in 2026, the average duration from lodgement
of planning application to completion was four years, twice as long as a decade ago. These increasing durations matter for the outlook of near-term housing completions. With such prolonged delivery times, homes completed over the next two to three
years will come mainly from units already in the pipeline. Near-term supply therefore depends a lot on how quickly that pipeline progresses, in addition to the flow of new permissions.
This Box links project-level records across the planning, commencement and completion stages of housing delivery. It documents how many projects reach each stage, how long each stage takes, and how both have changed over time and builds on existing
work on this topic from Kelly et al. (2026), and Lyons and Sweeney (2025).
1. Data Sources and Measurement
We link residential project records from a commercial provider (BuildingInfo) to the national planning application database (NPAD, including An Coimisiún Pleanála for appealed cases) and the building-control register (BCMS) as an additional
source for commencement notices and completion certificates. In doing so we ensure that every project carries, as accurately as possible, a date for each stage of its delivery: application to planning approval, approval to commencement, and commencement
to completion (see Figure 1).
The housing delivery pipeline from application to completion
Figure 1: Schematic overview of the process
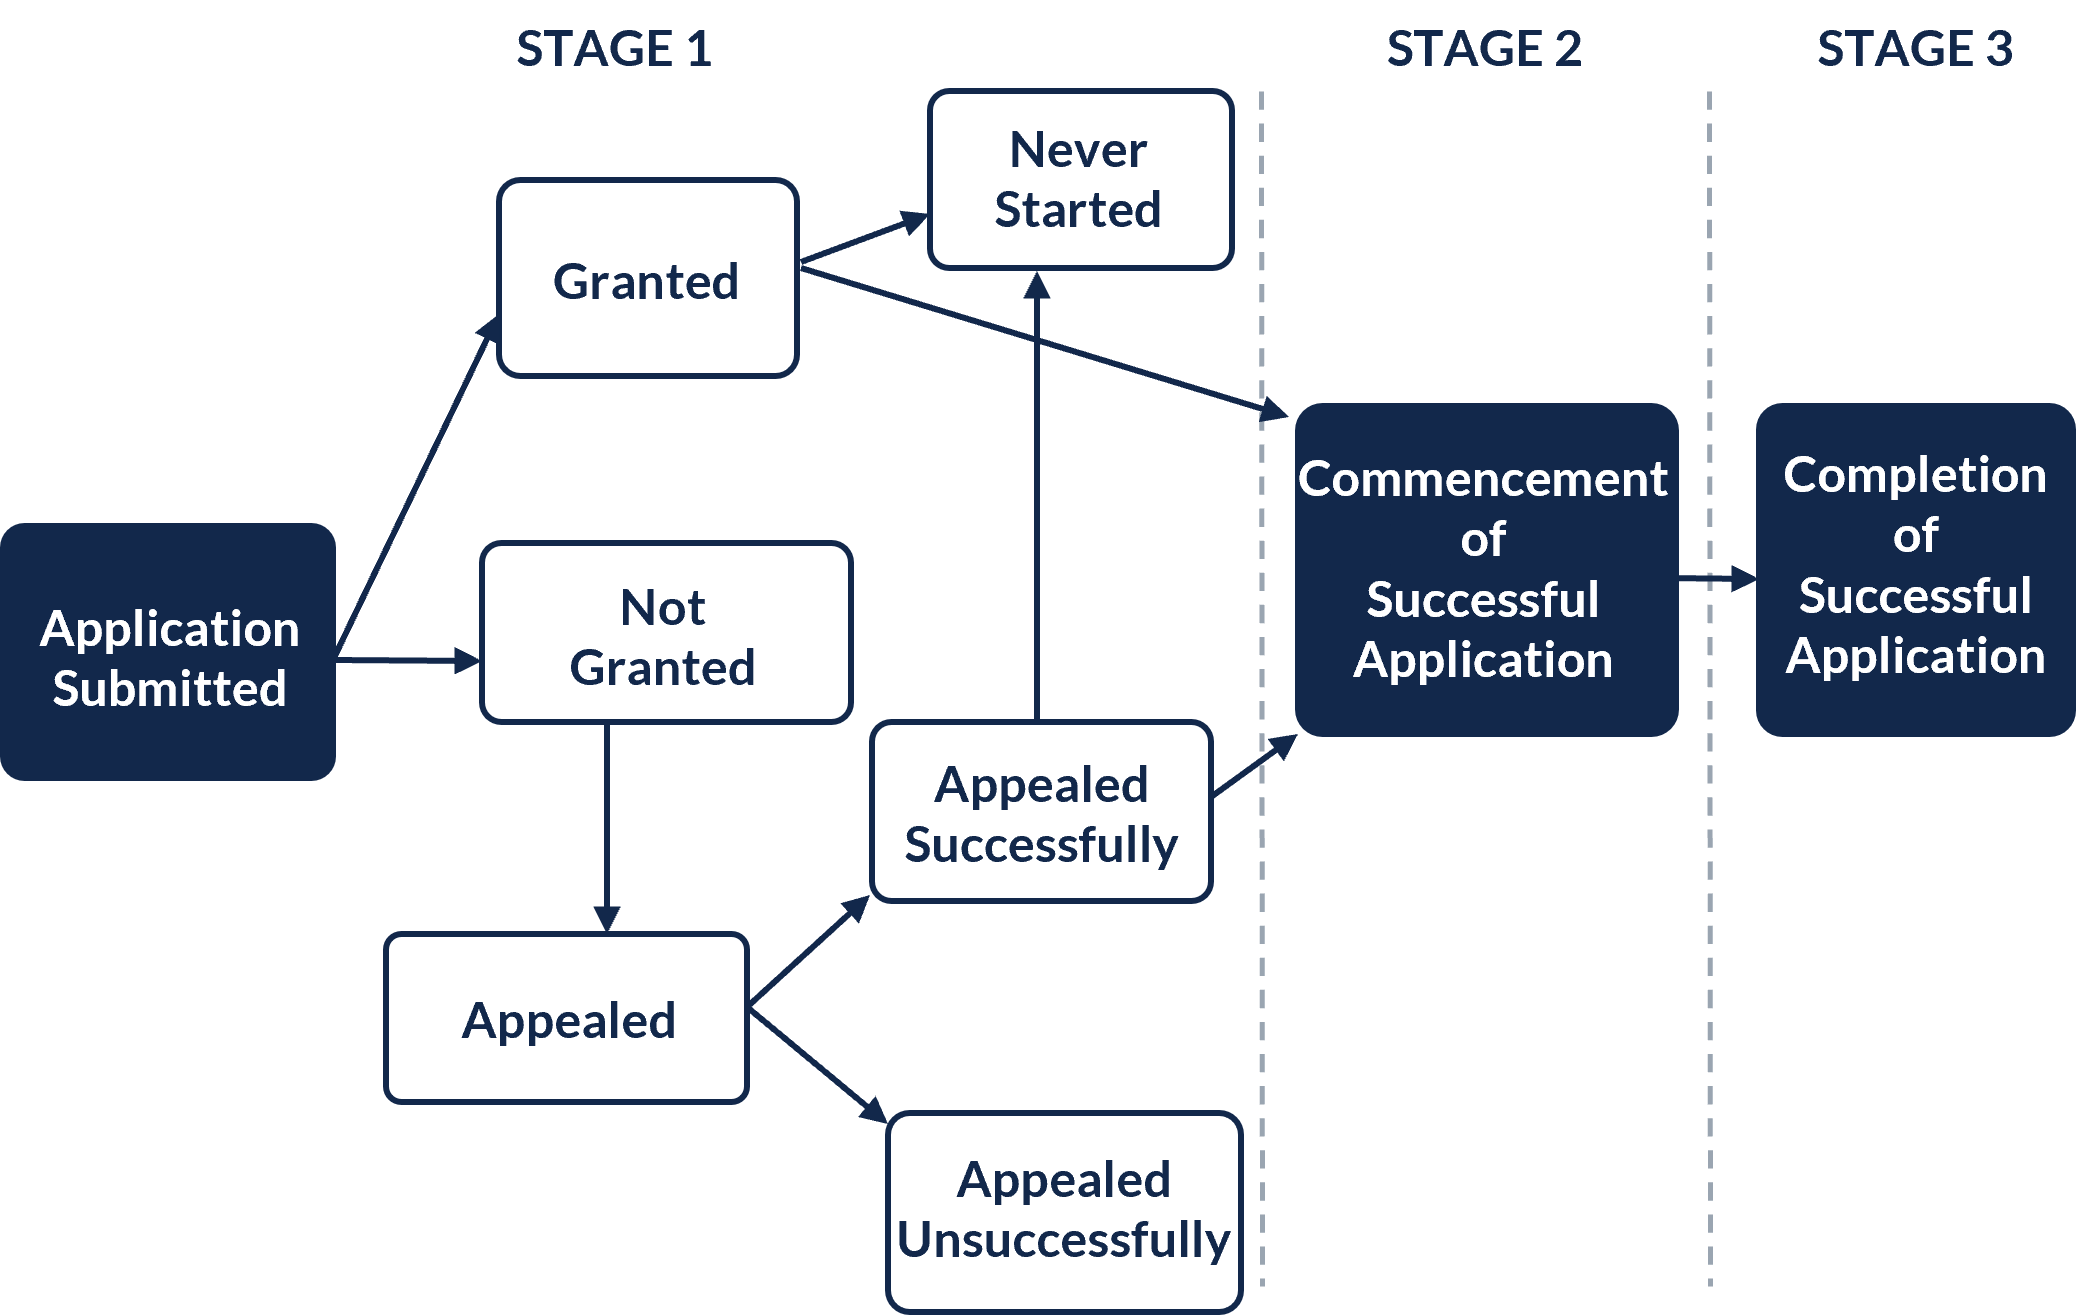
Since schemes with multiple units are often constructed in phases, we date the construction stage from commencement of the first phase to completion of the first phase within a project, so durations describe a multi-unit scheme's first phase. Together the linked records cover, in effect, the universe of planned and commenced residential construction in the state from 2017 onwards. There are differences between our compiled dataset and official aggregate data provided by Central Statistics
Office (CSO) due to differing approaches to data compilation. In particular, the CSO count completions based on new ESB connections, whereas we rely on reported completion dates. However, despite these differences our aggregated data compare closely to the trends observed in CSO numbers.
2. Units Split by Phase
Figures 2 and 3 follow each year's planning approved units to their latest status at end-August 2026 for the count of units and share of total, respectively. Of the units approved planning in 2017 to 2020 (cohorts whose five-year permissions have all
now expired), 25 to 32 per cent lapsed without construction ever starting. This share appears to sit at the high end in an international comparison.
About a third of units approved in 2021 to 2023 have yet to commence, as has the vast majority of units (>90 per cent) approved in the first eight months of this year.
At least a quarter of approved units aren't built before the statutory deadline
Figure 2: Number of units approved in each reference year by current status
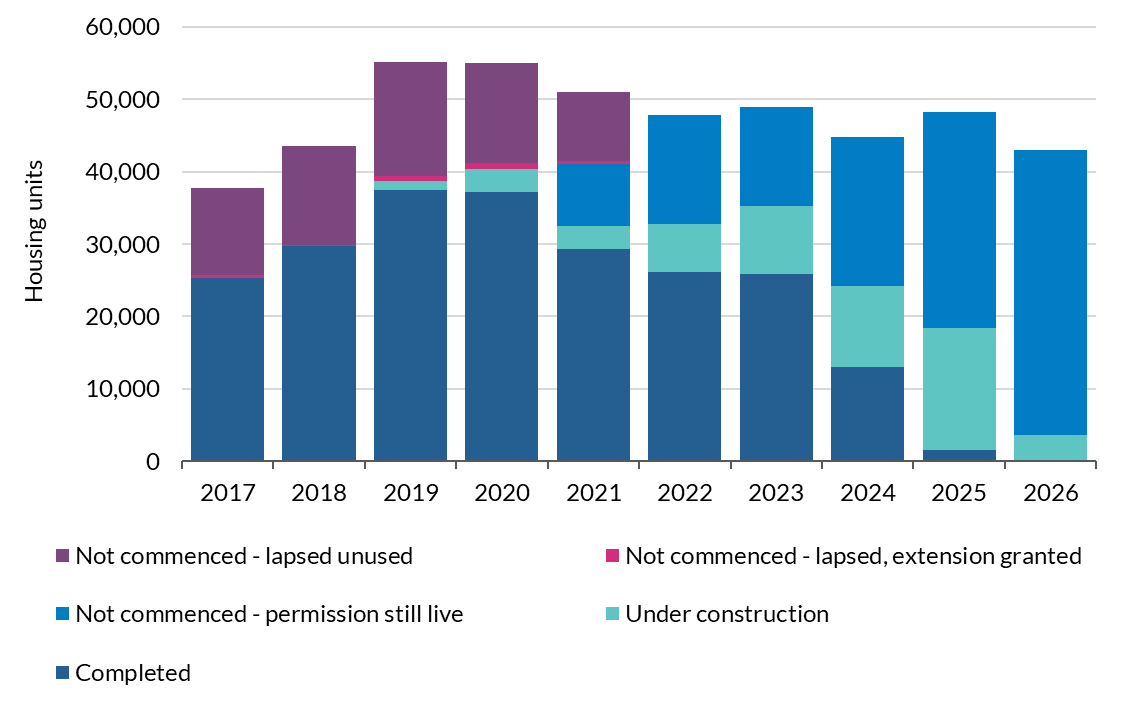
Source: BuildingInfo, NPAD, BCMS and Central Bank of Ireland calculations.
Notes: Units granted final consent in each year, by status on 29 August 2026, as quantity of units (Figure 2) and shares of units (Figure 3); 2026 covers approved units from January to 26 August.
Chart data in accessible format.
Figure 3: Share of units approved by status
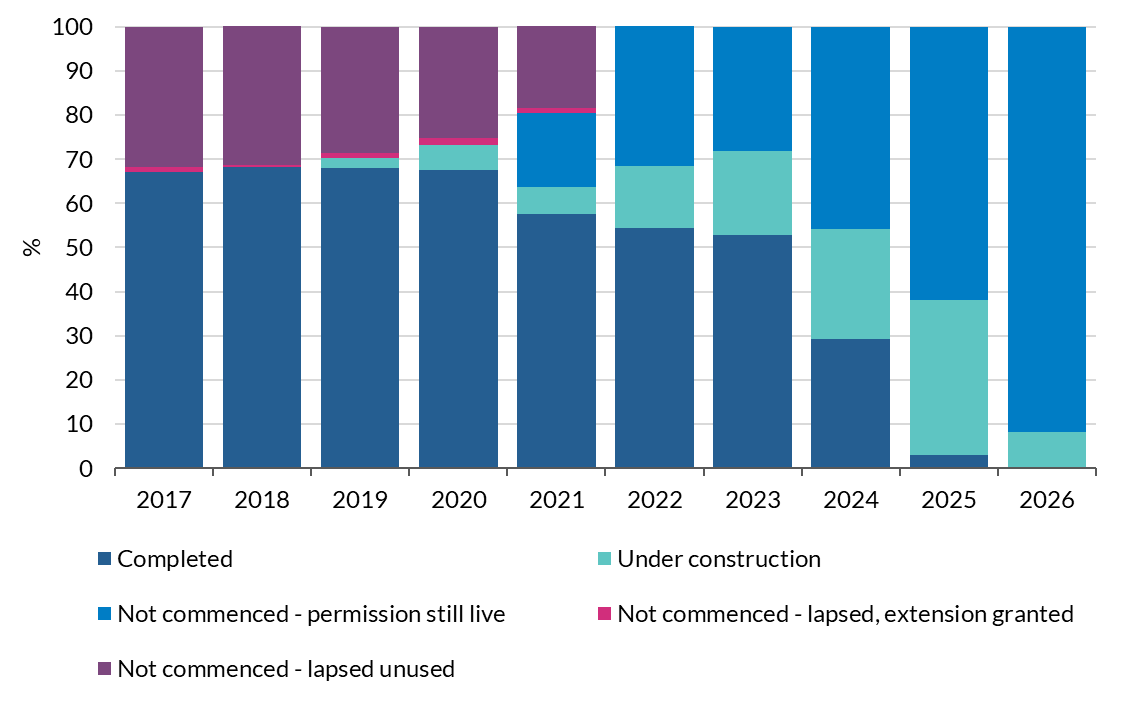
Source: BuildingInfo, NPAD, BCMS and Central Bank of Ireland calculations.
Notes: Units granted final consent in each year, by status on 29 August 2026, as quantity of units (Figure 2) and shares of units (Figure 3); 2026 covers approved units from January to 26 August.
Chart data in accessible format.
3. Total Time from Application to Completion
Figure 4 shows the time from planning application to first completion for the homes completed each year. In each case we have deducted the Covid-19 site lockdown durations in 2020
and 2021 from each affected project. Homes completed in 2016 took a median of 21 to 26 months depending on build type; those completed so far in 2026 took 44 to 50. One-off houses and apartments now take around two-and-a-half times as long as in 2017
and scheme housing nearly twice as long. The rise is gradual and continuous rather than a break at any single date. Although the Covid-19 period is likely to have contributed
to commencement and completion delays, the increasing trend we observe pre-dates, and continues after, the pandemic period. Figures 5 to 8 split the overall time from application to completion into the various stages involved in housing delivery.
Total delivery times have roughly doubled Since 2017
Figure 4: Median duration in months
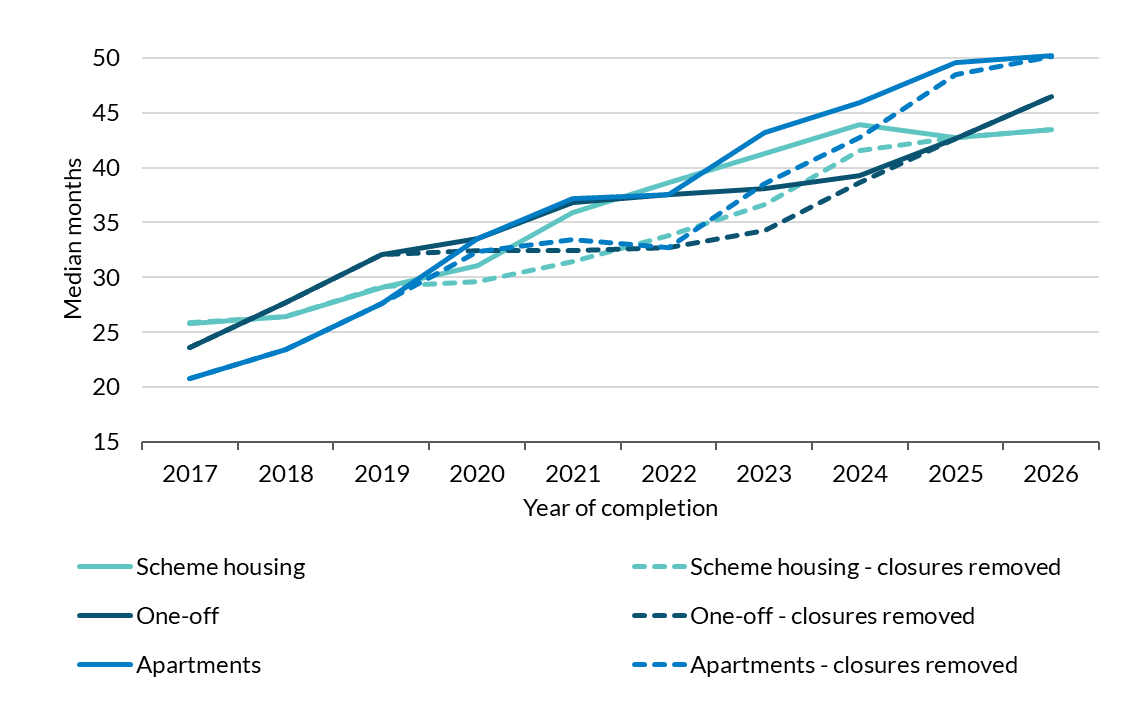
Source: BuildingInfo, NPAD, BCMS and Central Bank of Ireland calculations.
Notes: Months per scheme for the homes completed in each year. One-off: self-build houses; scheme housing: residential-sector schemes other than apartments (including mixed developments); apartments: residential-sector apartment schemes. Site closures: 28 March–18 May 2020 and 8 January–12 April 2021. 'Closures removed' subtracts the closure days falling inside each scheme's interval. For phased apartments and multi-unit schemes we measure from application date to completion of first phase of units. 2026 covers January to 29 August.
Chart data in accessible format.
3.1 Application to Approval Granted
Figure 5 shows the median time from application to planning approval. For one-off houses little has changed over time at 2 to 3 months throughout, and they are rarely appealed. For scheme housing and apartments, the stage lengthened from around 3 to 4
months to around 4 to 6, and the dashed lines, which exclude appealed schemes, show that the increase occurred at both the council stage and appeal stage. The median council decision time for non-appealed schemes and apartments rose by over a month
to around four and a half months, and the share taking more than four months rose from around a fifth to 56 per cent. This is not driven by a shift towards schemes with a larger number of units as the increase is present in every size band. Appeals
add to this duration, with the 16 to 20 per cent of schemes completing in 2024 to 2026 that passed through An Coimisiún Pleanála taking an average of 13 to 14 months to reach final approval. The increase in the appealed lines from 2022
onward reflects the Board's backlog years, which have since been cleared. Judicial reviews are not separately observable in our data, so their contribution to consent times
cannot be measured here.
Increasing consent times come from scheme housing and apartments
Figure 5: Median duration in months
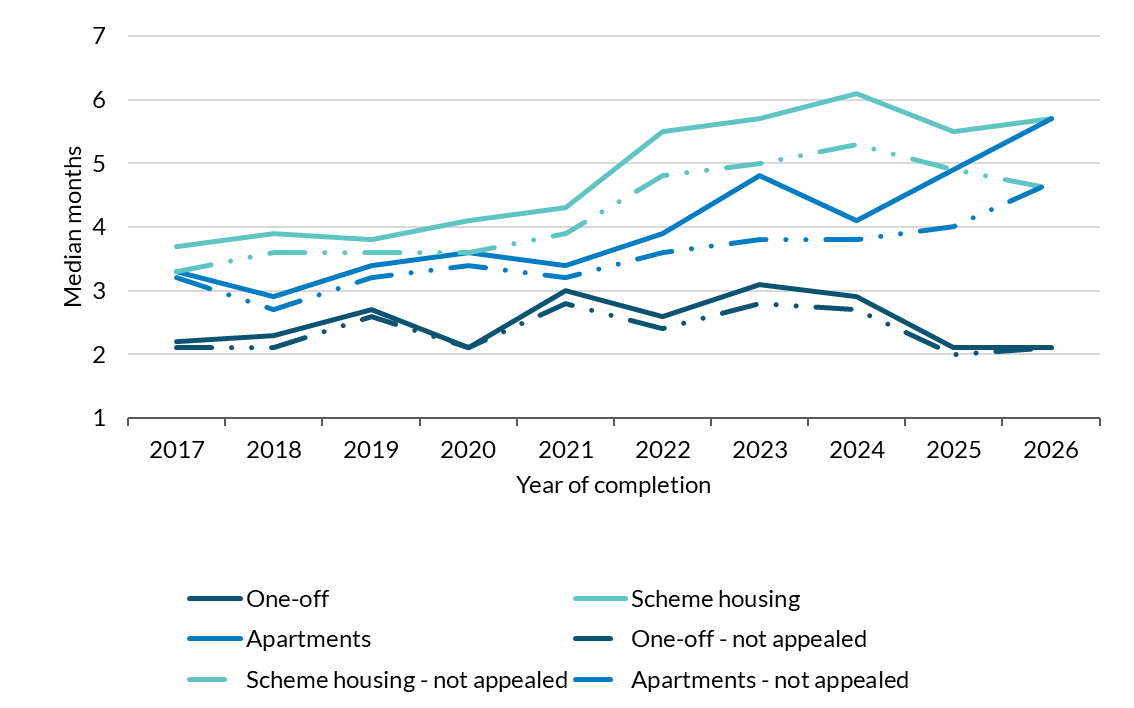
Source: BuildingInfo, NPAD, BCMS and Central Bank of Ireland calculations.
Notes: Median months per scheme for the homes completed in each year. Final consent is the An Bord Pleanála decision where the scheme was appealed, otherwise the council decision. Solid lines: all schemes of the type; dashed lines: schemes that were not appealed. 2026 covers January to 29 August.
Chart data in accessible format.
3.2 Approval Granted to Commencement
Next, we consider how long it takes approved applications to commence. Figure 6 follows the units approved in 2016–21, all observed for at least four and a half years, and shows the share that had commenced by each month after being approved. Around
half of one-off houses commence within a year (52 per cent), and 63 per cent within two. Over the following two and a half years the proportion commenced rises only marginally to 70 per cent, beyond which point the remaining units are unlikely to
commence within the statutory 5-year limit. Scheme housing and apartments keep converting more steadily past the two-year mark, scheme housing reached a 51 per cent commencement rate at two years and 68 by four and a half; apartments were slower still
with just over half of the approved units commencing within four and a half years.
One-off houses start sooner, developer schemes take longer to begin
Figure 6: Share of approved units commenced
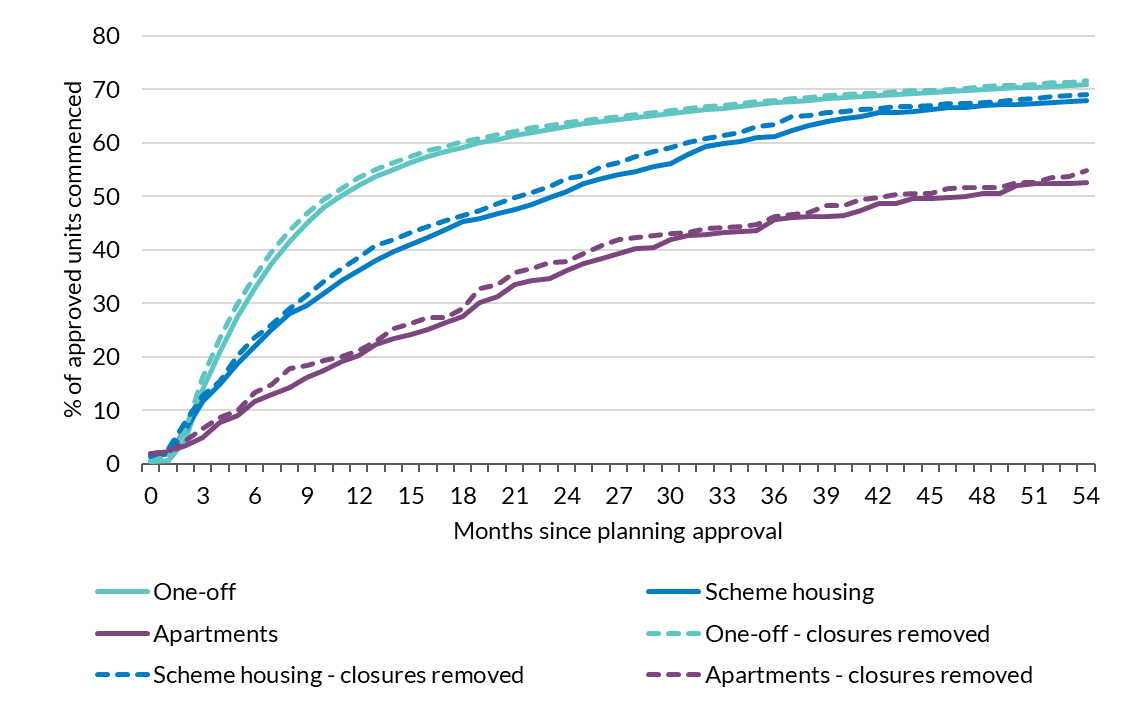
Source: BuildingInfo, NPAD, BCMS and Central Bank of Ireland calculations.
Notes: Cumulative share of units granted from 2016–21 (all observed 54+ months). Site closures: 28 March–18 May 2020 and 8 January–12 April 2021. 'Closures removed' subtracts the closure days falling inside each projects interval.
Chart data in accessible format.
Figure 7 shows the average (median) duration from planning approval to commencement of construction for the homes completed in each year. It has increased from around 6 months in 2017 to 10 months in 2026 for one-off houses, from around 8 months to a
year for scheme housing, and from 10 months to 18 months for apartments. The medians describe schemes that started, however, as Figure 2 shows, around a quarter of units never do. In April 2023 the government waived development levies for schemes
commencing by end-2024, with completion required by end-2026. The response was large. Commencement notices had run at around 7,000 units per quarter in 2021–22 and they peaked at 22,000 per quarter just before the deadline and collapsed to 3,000
just after it. Of the larger schemes that filed commencement notices in late 2023, 58 per cent had completed at least one home within 18 months; for late-2024 filings — posted in the waiver period — just 28 per cent completed within 18
months.
About 89,000 units approved in 2021–25 period have yet to commence. On the statutory five-year clock, almost half of these are due to lapse by end-2028.
The wait from approval to commencement has lengthened, particularly for one-off housing and apartments
Figure 7: Median duration in months
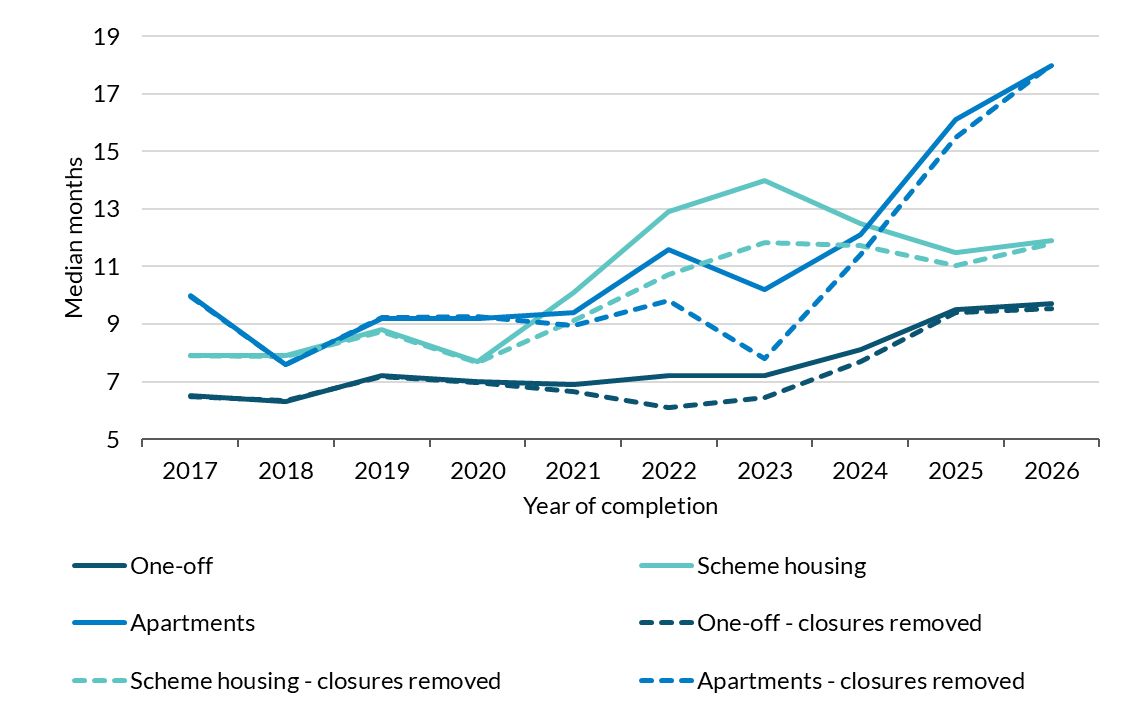
Source: BuildingInfo, NPAD, BCMS and Central Bank of Ireland calculations.
Notes: Months per scheme for the homes completed in each year. Site closures: 28 March–18 May 2020 and 8 January–12 April 2021. 'Closures removed' subtracts the closure days falling inside each scheme's interval. 2026 covers January to 29 August.
Chart data in accessible format.
3.3 Commencement to Completion
Figure 8 shows the average duration from construction commencement to completion, the stage with the largest and most persistent increase over time. One-off houses went from 13 months on site to around 25; scheme housing from around 11 months to 22 months;
apartments from 10 months to 23 months. The increase is present in every build type but is strongest for apartments. It coincides with a large rise in the volume of work under way, partly due to the waver scheme, as units commenced but not yet complete
rose from around 18,000 in mid-2016 to around 99,000 in mid-2025, while construction employment rose from around 119,000 to 190,000, so units in progress per worker more than tripled. Increases in construction durations may reflect a range of factors
including skilled-labour shortages, availability and timeliness of utility connections (water, sewage, electricity), unforeseen changes in financing and construction costs, and various other site-level factors. Relatedly we find that, after build
type, the strongest predictor of a project's time on site is how long it waited to commence. The data does not allow us to separate the time taken to physically build a housing
unit versus the foundational and preparatory work around the site that is required before building commences. Based on reports of delays in securing water, sewerage and electricity services for housing developments in Ireland, it is likely that these
factors have been prominent in lengthening the overall time from commencement to completion.
Time from commencement to completion has risen for all build types
Figure 8: Median duration in months
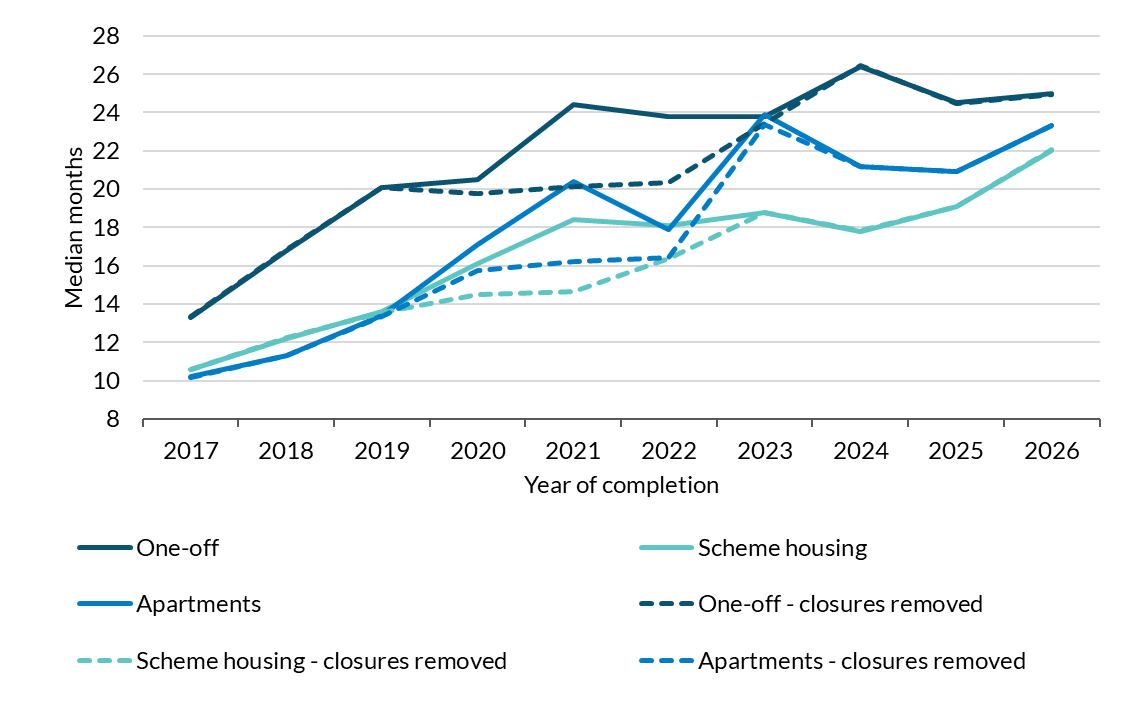
Source: BuildingInfo, NPAD, BCMS and Central Bank of Ireland calculations.
Notes: Months per scheme for the homes completed in each year. Site closures: 28 March–18 May 2020 and 8 January–12 April 2021. 'Closures removed' subtracts the closure days falling inside each scheme's interval. First completion is the first BCMS completion certificate, else the BuildingInfo end date. 2026 covers January to 29 August.
Chart data in accessible format.
4. Conclusion and Implications for the Completions Outlook
Two factors weaken the link between planning permissions for dwellings and completions. A given flow of planning approvals yields roughly a quarter fewer homes than were approved and now delivers the remainder far later than it did a decade ago. Homes
completing in 2027 will come largely from schemes commencing in 2025–26, when commencements fell sharply after the waiver deadline. Combined with on-site durations of 18 to 25 months, this weighs on the projection for completions in 2027. Council/An
Coimisiún Pleanála decision times remain slightly elevated, but the increase there is a few months against the average construction phase taking a year longer. Activation incentives, such as the government waiver scheme, target the stage
where a quarter of consented units never commence. Such incentives can move the timing of commencements substantially, although it is not clear the extent to what they improve the long-term stock of completions. Furthermore, current labour shortages
limit the effectiveness of policy initiatives aimed at expediting the planning approval to commencement phase. Construction capacity may account for some of the increase in delivery times, with units under construction per worker rising from 0.15
in 2016 to a peak of 0.6 in early 2025, following the waiver period. Recent measures including the Planning and Development Act 2024, the Accelerating Infrastructure Report and Action Plan and the Delivering Homes, Building Communities: An Action
Plan on Housing Supply and Targeting Homelessness (2025–2030) have been introduced to help improve the efficiency of the planning system, streamline legal challenges and unlock serviced land. If actioned in an effective and timely manner, they
should facilitate the delivery of increased housing supply outlined in our central forecast.
Endnotes
An Timpleallacht Gheilleagrach
Leanann athruithe struchtúracha suntasacha, i dteannta dálaí timthriallta rialta gnó, de thionchar a imirt ar an ngeilleagar domhanda agus ar Éirinn. Tá ardteannas trádála ann i gcónaí agus tá gnóthaí ag dul i dtaithí ar thimpeallacht trádála atá scoilte agus nach bhfuil chomh fabhrach céanna leis an timpeallacht a bhí ann le blianta beaga anuas. Ina theannta sin - agus ag freagairt do thimpeallacht gheopholaitiúil atá níos luainí - tá athbhorradh faoi phraghsanna fuinnimh domhanda de thoradh an chogaidh idir an Iaráin agus na Stáit Aontaithe, rud a spreagann athuair na brúnna a d’eascair as ionradh na Rúise ar an Úcráin, brúnna nach ndeachaigh i léig ach le déanaí. Le linn an tsamhraidh, chonacthas na teochtaí is airde riamh ar fud na hEorpa, mar aon le triomach faidréiseach, agus is é is dóichí gur tharla teagmhais adhaimsire den sórt sin de thoradh éifeachtaí an athraithe aeráide. Chuir sé sin brú ar tháirgeadh agus iompar bia, rud a ghéaróidh boilsciú atá ard cheana féin. Níos gaire don bhaile, tá athruithe struchtúracha ag teacht ar an margadh saothair, lena n-áirítear glacadh teicneolaíochtaí nua, an daonra ag dul in aois i gcónaí agus ról méadaitheach tábhachtach na himirce glan isteach araon - rud is cúis le tuairim is dhá thrian den fhás fostaíochta cheana féin. I bhfianaise na bhfórsaí suntasacha seo, tá athléimneacht an-mhaith léirithe ag an ngeilleagar go dtí seo ach tá gá le roghanna cúramacha beartais agus pleanáil fhadtéarmach chun fás eacnamaíoch seasmhach agus dífhostaíocht íseal a chothú, boilsciú a laghdú agus chun staid bhunaidh an airgeadais phoiblí a fheabhsú.
Sna sonraí bliantúla Cuntas Náisiúnta arna bhfoilsiú ag an bPríomh-Oifig Staidrimh i mí Iúil, deimhnítear fás tapa leanúnach ar an ngeilleagar sa tréimhse i ndiaidh na paindéime. An bhliain seo caite, tháinig fás 4.7 faoin gcéad ar an ngeilleagar, arna thomhas ag Ollioncam Náisiúnta (OIN*) modhnaithe réadach. Ó 2021 i leith, tá meánráta bliantúil fáis de 5.5 faoin gcéad taifeadta ar OIN* réadach, go mór os cionn ráta fáis ionchasach measta an gheilleagair. Ciallaíonn luas tapa an fháis gur tháinig méadú 35 faoin gcéad nó €89 billiún ar mhéid foriomlán an gheilleagair - bunaithe ar OIN* i dtéarmaí réadacha - idir 2019 agus 2025. Tá fás fostaíochta, ioncaim níos airde agus ioncam méadaithe rialtais bainte amach ag an bhfás sa gheilleagar. In anailís nua arna foilsiú san Fhaisnéis Ráithiúil seo, deimhnítear tábhacht mhéadaitheach na hearnála ilnáisiúnta d’fheidhmíocht eacnamaíoch na hÉireann arna tomhas le OIN* (Bosca B). Cé go bhfuil saothar agus ioncam eile ó fhoinsí intíre ina gcúis leis an gcuid is mó den OIN* réadach, tá méadú suntasach tagtha le himeacht ama ar an méid a chuireann FINanna leis sin (lena n-áirítear cáin chorparáide ó FIN, tuarastail agus ioncam gaolmhar eile) - ó 16 faoin gcéad in 2013 go dtí 26 faoin gcéad in 2025.
Deimhnítear leis na sonraí is déanaí go bhfuil an fuinneamh dearfach faoin ngníomhaíocht eacnamaíoch tugtha anonn ó 2025 chuig an gcéad leath de 2026, ach go bhfuil difríochtaí suntasacha le feiceáil ar luas na gníomhaíochta i gcodanna éagsúla den gheilleagar. Fiú leis an mboilsciú níos airde, leanann caiteachas tomhaltóirí de bheith ag fás go seasmhach. Tá spreagadh suntasach á thabhairt ag infheistíocht a bhaineann le FIN don éileamh modhnaithe intíre. Tá próifíl na hinfheistíochta sin míchothrom sna sonraí ráithiúla ach tá an treocht bhunúsach soiléir sa mhéid go bhfuil ardú de bhreis ar aon trian tagtha i dtéarmaí réadacha ar leibhéal na hinfheistíochta in innealra agus i dtrealamh i dtréimhse trí bliana. Tá méaduithe suntasacha ar chaiteachas a bhaineann leis an intleacht shaorga agus ar chrua-earraí lárionad sonraí ag gnólachtaí ilnáisiúnta in Éirinn mar bhonn taca faoin bhfás ar an ngné seo den infheistíocht a mbaineann sciar mhór allmhairí léi. Áirítear na hallmhairí seo san éileamh modhnaithe intíre atá ag an leibhéal uachtarach de réimse na meastachán ar fhás intíre, eadhon beagán os cionn 3 faoin gcéad sa chéad leath de 2026. I dtomhais eile, amhail aschur na n-earnálacha atá bunaithe go hintíre den chuid is mó, tá luas fáis níos moille le feiceáil de thuairim is 2 faoin gcéad.
Ag féachaint romhainn, is dócha go leanfaidh an pátrún sin le linn bhlianta na réamhaisnéise, sa mhéid go meastar go mbeidh an t-éileamh modhnaithe intíre ag fás de réir meánráta bliantúil níos airde de 3.5 faoin gcéad, i gcomparáid le fás 3.1 faoin gcéad ar OIN* - agus beidh an ceann deireanach sin gar d’acmhainneacht fhadtéarmach mheasta an gheilleagair. Ag glacadh leis go maolóidh boilsciú go dtí thart ar 2 faoin gcéad faoi 2028 i gcomhréir leis na réamhaisnéisí san Fhaisnéis Ráithiúil seo, tacóidh gnóthachain mheasartha ar ioncam réadach ó 2027, mar aon leis an maolán ó choigilteas ard teaghlaigh, le fás seasmhach ar chaiteachas tomhaltóirí. Tá réamhaisnéisí maidir le boilsciú mórán gan athrú ón bhFaisnéis Ráithiúil roimhe seo (mí an Mheithimh) ach tá ardleibhéal éiginnteachta ag baint leis na réamh-mheastacháin bhonnlíne agus tá na rioscaí don fhás cothrom tríd is tríd agus tá na rioscaí don bhoilsciú ar an taobh thuas.
I dteannta méaduithe ar chaiteachas tomhaltóirí, meastar go dtacóidh méadú ar infheistíocht as seo go dtí an bhliain 2028 leis an éileamh modhnaithe intíre. Cé go bhfuil athbhreithniú aníos déanta san Fhaisnéis Ráithiúil seo ar an infheistíocht mhodhnaithe fhoriomlán, tá cuma éiginnte ar an scéal. Leis an méadú ar éileamh ar bhogearraí agus ar threalamh a bhaineann leis an bhfás ar IS, ba cheart go dtacófaí le méaduithe ar infheistíocht faoi stiúir FIN sna blianta atá le teacht. Féadfaidh go mbeidh fás níos láidre ar an ngné seo sa ghearrthéarma thar an méid atá sna réamh-mheastacháin bhonnlíne má leanann an t-éileamh domhanda de bheith ard. Maidir le haschur tithíochta, cuirtear fáilte roimh an méadú ar ghníomhaíocht foirgníochta cónaithe sa mhéid go bhfuil beagnach dhá oiread na tithíochta curtha i gcrích idir 2017 agus 2025. Meastar go mbeidh méaduithe breise ar aschur tithíochta as seo go dtí 2028 ach go mbeidh sé seo ag brath ar dhul chun cinn a dhéanamh maidir le gnéithe éagsúla a mbíonn tionchar acu ar sholáthar tithíochta. Is doiligh brí a bhaint as comharthaí ó thosuithe tithe i bhfianaise an bhorrtha arna spreagadh as beartais in 2024. Ina dhiaidh sin, tháinig laghduithe ar thosuithe in 2025 agus 2026, fad atá ceaduithe pleanála bliantúla cobhsaí tríd is tríd sna 30,000 láir. Thairis sin, léirítear in anailís san Fhaisnéis Ráithiúil seo gurb ionann agus ceithre bliana an meánfhad a bhíonn ann ón iarratas pleanála tosaigh a chur isteach go dtí an cur i gcrích, i gcás phíblíne na gníomhaíochta tithíochta reatha (áitribh atá ceadaithe nó tosaithe cheana féin), dhá uair chomh fada le deich mbliana ó shin (Bosca A). Cuireann na gnéithe sin isteach ar an ionchas foriomlán maidir le tithíocht a chuirfear i gcrích agus leagann sé béim ar an tábhacht a bhaineann le cur chun feidhme tráthúil na n-athchóirithe chun soláthar príomh-bhonneagair náisiúnta a luathú, lena n-áirítear na hathchóirithe sin a leagtar amach sa Tuarascáil agus Plean Gníomhaíochta um Luathú Bonneagair. Leis na hathchóirithe sin, má chuirtear i ngníomh iad ar mhodh éifeachtach, tráthúil, i dteannta beart lena méadófar gníomhaíocht, ba cheart go n-éascófaí soláthar tithíochta breise mar atá leagtha amach sa réamhaisnéis lárnach dár gcuid.
Taobh amuigh de chúrsaí tithíochta, léirítear sna sonraí le déanaí an bhearna atá ann idir fás ar an ngeilleagar, ar an bhfostaíocht agus ar an daonra agus ar bhonneagar an Stáit níos leithne. Tháinig méadú 67,000 nach mór ar an daonra go dtí 5.52 milliún le linn na bliana suas go dtí mí Aibreáin 2026. Toisc go bhfuil an méadú nádúrtha ar an daonra ag moilliú, bhí trí cheathrú den mhéadú ar an daonra foriomlán inchurtha d’imirce glan isteach a bhfuil ról tábhachtach aici ó thaobh borradh a chur faoi sholáthar lucht saothair agus faoin bhfostaíocht, agus tá an chuid is mó den fhostaíocht sin i ngairmeacha beatha ardoilte. Cé go meastar go moilleoidh an fás ar fhostaíocht suas go dtí 2028, beidh an imirce ina gné ríthábhachtach i gcónaí i dtaca le soláthar lucht saothair a mhéadú, le turraingí maicreacnamaíocha a sheasamh agus le fás eacnamaíoch a choimeád ar bun.
Chuir praghsanna fuinnimh níos airde go mór le boilsciú príomha in 2026 de réir mar a chuir an cogadh idir na Stáit Aontaithe agus an Iaráin brú aníos ar phraghsanna idirnáisiúnta fuinnimh. I dteannta na mbrúnna seachtracha seo ar phraghsanna, tá an boilsciú ar sheirbhísí ardaithe i gcónaí. Léiríonn sé seo go páirteach tarchur na gcostas ionchuir níos airde agus, chomh maith leis sin, éileamh intíre leanúnach agus brúnna pá. Is é an príomhriosca go bhféadfadh éifeachtaí indíreacha teacht chun cinn, trína lorgódh oibrithe cúiteamh as laghdú pá trí éilimh níos airde ar phá ainmniúil, agus trína gcuirfeadh gnólachtaí na costais saothair níos airde sin ar aghaidh chuig praghsanna do thomhaltóirí chun corrlaigh bhrabúis a choinneáil ar bun. Cé nach bhfuil aon fhianaise ann maidir le héifeachtaí forleathana indíreacha go dtí seo, thógfadh sé níos mó ama orthu seo teacht chun cinn agus tá riosca suntasach ann i gcónaí, go háirithe má bhíonn suaitheadh fuinnimh níos seasmhaí i gceist nó má thagann gearú breise ar an gcoinbhleacht.
Ar leibhéal an limistéir euro, táthar ag freagairt do bhrúnna ardaithe boilscitheacha leis an mbeartas airgeadaíochta chun a chinntiú go gcobhsóidh boilsciú go hinbhuanaithe ag an sprioc arb ionann í agus 2 faoin gcéad sa mheántéarma. An 10 Meán Fómhair, d’ardaigh an Chomhairle Rialaithe na trí eochair-ráta úis de chuid BCE faoi 25 bhonnphointe, i ndiaidh méadú comhchosúil i mí an Mheithimh 2026. Leanann an choinbhleacht sa Mheán-Oirthear de bhrúnna boilscithe a ghiniúint, agus meastar go leanfaidh boilsciú de bheith i bhfad os cionn na sprice ar feadh tréimhse fhadaithe. Tá breithnithe na Comhairle Rialaithe ag brath ar shonraí i gcónaí agus leanfaidh an Chomhairle d’fhaisnéis nua a mheasúnú ar bhonn cruinniú ar chruinniú. Go háirithe, beidh cinntí na Comhairle Rialaithe maidir le rátaí úis bunaithe ar a measúnú ar an ionchas boilscithe, ar na rioscaí a bhaineann leis agus ar neart an tarchuir beartais airgeadaíochta.
I gcás geilleagar beag oscailte mar atá ag Éirinn, tá ról lárnach ag an mbeartas fioscach maidir le fás inbhuanaithe eacnamaíoch agus boilsciú íseal a bhaint amach sa mheántéarma. Chun an méid seo a bhaint amach, ba cheart go mbeadh an staid fhioscach fritimthriallach, i.e. ba cheart go dtacódh sí leis an ngeilleagar nuair a bhíonn sé ag feidhmiú faoi bhun a acmhainne inbhuanaithe (i.e. nuair atá dífhostaíocht ard ann) agus, i gcor dá mhalairt, ba cheart go laghdódh sí an t-éileamh nuair a bhíonn an geilleagar ag feidhmiú thar a acmhainn inbhuanaithe agus nuair a bhíonn rioscaí boilscitheacha iomarcacha ann. Tugann dálaí reatha agus dálaí tuartha eacnamaíocha agus an mhargaidh saothair le fios nach bhfuil spreagadh breise buiséadach ag teastáil ón ngeilleagar faoi láthair. Buntáiste a bhaineann le staid beartais fhritimthriallach a leanúint sna dálaí reatha eacnamaíocha is ea go bhféadfaí maoláin mhóra fhioscacha a charnadh agus go bhféadfaí iad sin a úsáid ansin dá mbeadh cor chun donais sa ghníomhaíocht eacnamaíoch agus méadú ar dhífhostaíocht.
Ó tharla go bhfuil boilsciú i bhfad os cionn 3 faoin gcéad cheana féin agus an chothromaíocht rioscaí don réamhaisnéis lárnach ar an taobh thuas, sheachnófaí brúnna praghais sa gheilleagar a ghéarú trí sheasamh buiséadach fritimthriallach a leanúint. I dteannta leithdháiltí suntasacha ar lá an bhuiséid, bhí róchaiteachas coitianta le blianta beaga anuas (i gcomparáid le pleananna tosaigh an Rialtais), rud a thugann spreagadh breise don gheilleagar. Mar a léirítear in anailís, chuirfeadh róchaiteachas leanúnach i gcomhréir le rátaí fáis i ndiaidh 2021 tuairim is 1 faoin gcéad leis an leibhéal praghsanna faoi dheireadh na tréimhse deich mbliana seo.
Ba cheart na huasteorainneacha caiteachais gan athrú i Ráiteas Geilleagair an tSamhraidh (i gcomparáid leis an Tuarascáil Bhliantúil ar Dhul Chun Cinn i mí Aibreáin 2026) a choinneáil do Bhuiséad 2027 chun go dteorannófar neamhchosaint fhioscach ar fháltais ó cháin chorparáide, arna gcomhchruinniú i measc líon beag gnólachtaí ilnáisiúnta, ar fáltais iad a d’fhéadfadh a bheith sealadach.
Trí sholáthar bonneagair phoiblí nua a uasmhéadú chun dul i ngleic le heasnaimh aitheanta i bpríomh-bhonneagair náisiúnta agus chun infheistíocht phríobháideach níos airde a shluachistiú, spreagfar acmhainn fáis an gheilleagair san fhadtéarma. Le hinfheistíocht atá dírithe ar dhícharbónú an gheilleagair a luasghéarú, chuideofaí leis an neamhchosaint ar phraghsanna luaineacha breosla iontaise allmhairithe (lena n-áirítear de thoradh turraingí geopholaitiúla) agus thacófaí le costas fuinnimh níos cobhsaí do theaghlaigh agus do ghnóthaí Éireannacha. Leis na gníomhaíochtaí seo, rannchuideofaí freisin le spriocanna a bhaint amach i ndáil le laghduithe astaíochtaí, ar spriocanna iad nach bhfuil á mbaint amach faoi láthair. Freagairt níos inbhuanaithe ar an timpeallacht ardbhoilscithe reatha a bheadh inti seo ná na giorruithe máil ar bhreoslaí atá neamhdhírithe den chuid is mó agus a dhéanann difear do chomharthaí praghais agus atá ina riosca maidir le cúngú breise nach dteastaíonn ar an mbonn cánach. Maidir le teaghlaigh atá neamhchosanta go mór ar éifeachtaí na bpraghsanna fuinnimh níos airde, féadfar na teaghlaigh is leochailí a chosaint le bearta sealadacha, spriocdhírithe, fad a chinnteofar go gcothófar athléimneacht san airgeadas poiblí leis an seasamh buiséadach foriomlán.
Endnotes