Key Insights
The Energy Efficiency Premium (hereafter called the premium) - that is, the increase in property price associated with a single grade increase in the BER rating - was on average 1.6% between 2015 and 2024. The premium decreased from 1.9% in 2015 to 1.3% in 2024.
In 2024, 59% of properties for sale in Daft had a BER ranging from B3 to D1. If a property were to improve its BER from a D1-rating to a B3-rating, the four BER-grade difference would amount to a premium of 5.2%.
The change in the premium over time differs by market segment. The premium is highest for lower-priced properties. However, the premiums converged over the ten years, decreasing for lower-priced properties and rising for higher-priced properties, potentially driven by higher-income households having greater capacity to prioritise energy efficiency.
Introduction/About This Study
Household Energy Efficiency
The Irish Building Energy Rating (BER) scheme provides property-level energy efficiency (EE) grades, ranging from A1 to G, based on expected energy consumption. The BER also plays a key benchmarking role within the national Climate Action Plan (DCEE, 2025) including a target of completing 500,000 residential energy retrofits to B2 (or above) standard by 2030. Energy efficiency improvements lead to multiple direct and indirect benefits. From a public, economy-wide perspective, a more efficient building stock leads to lower national greenhouse gas emissions, lower future EU fines from missed targets, and lower reliance on non-domestic energy supplies which can be sensitive to geopolitical developments.
From the householder perspective, higher EE can lead to improved health and comfort, and lower energy bills through reduced energy use and renewable energy (SEAI, 2024). More efficient properties are also more resilient to future energy price and supply shocks. An additional cost saving is potentially available to mortgaged households through lower interest rates ("green mortgages"), which, in Ireland, are generally available for properties with BER of B3 or higher.
An additional benefit accruing to property owners is the potential higher property value associated with EE upgrades. Numerous national and international studies show that EE is capitalised into property values. A series of Irish studies find that more energy efficient properties command higher prices under the BER system, typically in the range of 2–3% per grade improvement (Hyland et al., 2013; Stanley et al., 2016). Experimental evidence shows that improved energy cost information (rather than physical energy units) leads to higher demand for efficiency (Carroll et al., 2024). The relationship between EE and property value is referred to as the "energy efficiency premium" (premium) in the literature.
Financial Sector Linkages
From a banking perspective, EE has potential benefits for banking sector credit risk, with research showing that EE decreases the probability of default (PD) and loss given default (LGD). These could be systemically relevant factors in the long run given that mortgaged properties represent a high share of banking exposures -- 49% of total domestic credit in 2025 Q3 (CBI, 2026).
Lower PDs may be driven by the savings from reduced energy bills and, in some cases, reduced insurance costs-- this route impacts borrowers with low levels of disposable income the most (Billio et al., 2021). Kaza et al. (2014) report that only 9% of Energy Star homes in the US defaulted (15% of non-Energy Star homes). Meanwhile, the share of highly efficient properties in the UK with mortgage payment arrears is 7% and 18% lower than those of medium and low EE properties, respectively (Guin and Korhonen, 2020).
Numerous research studies of property sales data show an economically and statistically significant premium (Brounen and Kok, 2011; Hyland et al., 2013; Kahn and Kok, 2014; Khazal and Sønstebø, 2023; Stanley et al., 2016; Taruttis and Weber, 2022; Walls et al., 2017). These findings have potential credit risk implications for the banking sector through the LGD channel. In the event of a default, the bank's ability to recoup losses (liquidate the collateral) is higher due to the higher values associated with high-EE properties (Sanderford et al., 2015). This effect applies even during periods of stress in the real estate market (Hajnal et al., 2022).
Distributional Considerations
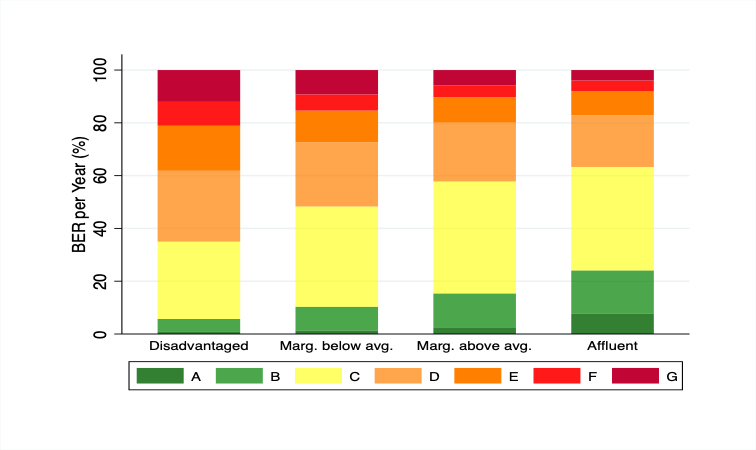
Energy efficiency varies significantly by income. Using the Pobal HP Deprivation Index (Pratschke, 2022), Figure 1 demonstrates that the share of A-rated properties is highest in more affluent areas. Disadvantaged communities have lower rates of efficiency, which reduces their energy resilience, exposing a population that is already vulnerable to rising energy costs. These communities are more at risk of energy poverty, with poorer health outcomes caused by inadequate heating and increased financial vulnerability due to stricter budget constraints (Estévez and Tovar-Reaños, 2026; Kelly et al., 2026; Kinnear and Julienne, 2025). Income restrictions also limit energy efficiency improvements, with over 70% of those who have investigated ways to reduce energy consumption through such improvements lacking sufficient funds to proceed (SEAI, 2017).
More Disadvantaged Areas Have a Greater Stock of Inefficient Properties Relative to More Affluent Areas
Figure 1: Distribution of BER Categories by Level of Deprivation in the Area
Source: Own calculations using daft.ie data and Pobal HP Deprivation Index
Note: The deprivation index ranges 7 categories from "Very Affluent" to "Extremely Disadvantaged". We grouped these 7 categories into 4 groups, "Disadvantaged – extremely disadvantaged", "Marginally below average", "Marginally above average", and "Affluent – very affluent" to capture income by areas. "Marg below avg." refers to "marginally below average affluence". "Marg above avg." refers to "marginally above average affluence". Figure 2 outlines the BER scale. The deprivation index is applied by small area.
Accessibility: Get the data in accessible format. (CSV 18.94KB)
Research Setting and Main Findings
Prior literature in Ireland estimates the premium, but the change in the premium over time is yet to be studied. Our research estimates the change in the premium using listed prices in Irish second-hand residential sales between 2015 and 2024 using daft.ie data and a large number of household and location characteristics.
After accounting for other factors that affect property prices, our analysis shows that more energy efficient properties have an average premium of 1.6% over the ten years relative to a similar but inefficient counterpart.
The average premium decreases over the ten years from 1.9% in 2015 to 1.3% in 2024. This varies by market segment: for example, lower-priced properties have a decreasing premium over the ten years while more expensive properties have a rising premium.
Measuring the Energy Efficiency Premium
The Dataset
Our analysis uses listed prices from property sales data from daft.ie, which contains 90% of all property advertisements in Ireland (daft.ie, 2024). The dataset contains a range of property details, including locational features, structural characterises and energy attributes. To ensure that the EE premium is not capturing higher quality levels in properties, we build on Gillespie et al.'s (n.d.) research by including a measure of the internal condition or quality of the property in our analysis. This variable is categorised into luxury, excellent condition, good condition, needs, work, and derelict. This ensures that the premium is not overstated due to the underlying condition of the property. Our final dataset contains 437,710 observations.
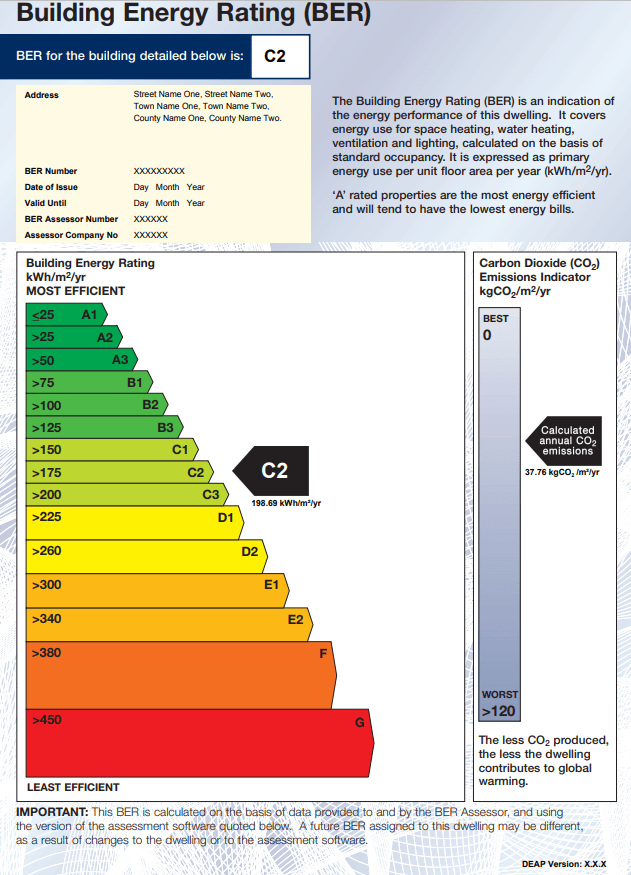
We use the 15-grade BER rating outlined in Figure 2, which is a forecast of annual expected energy units per metre squared (kWh/m²/year). The BER is calculated by registered BER assessors using a common methodology designed for the Irish building stock. Ratings are primarily driven by characteristics such as property insulation, space and water heating system and microgeneration (predominantly solar) (SEAI, 2014). Importantly, the BER is based on "typical occupancy" which assumes that energy service demand (for example, the target internal temperature in the whole property) is constant across grades, which may overestimate consumption at lower grades due to cost-related pressures. The EE improves as the BER moves from G to A, so a B1 is more efficient than a B2.
Figure 2: Building Energy Rating Scale
Source: Sustainable Energy Authority of Ireland, 2025
Note: The efficiency of the property improves for each unit increase from G to A1.
Homeowners can improve the BER of their property by increasing the EE of the property. 210,112 properties increased their BER by at least one full letter category between 2009 and 2025, 50% of which improved their BER from an initial rating of C or below to an A or B rating in their most recent assessment. 18% of the total stock of BER rated properties were rated A in 2025, while 99% of properties built between 2020 and 2025 received A ratings (CSO, 2026).
The Analysis
Our analysis measures how energy efficiency affects listed property prices in the Irish second-hand residential market, and how this relationship has changed over time. This impact of energy efficiency on property prices is referred to as the "premium". Our first analysis describes the average value increase across all BER grades, while our second approach splits the BERs into high (A2-B3), mid (C1-D2), and low (E1-G) efficiency groups to differentiate across BER segments. These will be labelled A/B, C/D, and E/G, respectively. We also explore premium trends across different parts of the property price distribution (for example, low-, mid-, and high-value segments). Importantly, each of our analyses include an extensive list of locational and property characteristics, which allow us to better isolate the relationship between efficiency and property price.
We also avail of transaction prices from the Property Price Register. However, this results in a much smaller dataset, possibly due to Eircode matches with the daft.ie dataset.
The Irish Energy Efficiency Premium
The Average Premium in Irish Listed Prices
Our results show that property values are higher at higher EE levels. Our first set of results (Figure 3) show a premium of 1.9% in 2015, meaning that for each one-unit improvement along the BER scale (for example, B2 to B1) there is a 1.9% increase in the listed price of the property. In 2015, the price for an A2-rated property would be approximately 24.7% higher than the price for a G-rated property.
There is an average premium of 1.6% per BER grade improvement (average effect between 2015 and 2024). The premium remains positive but declined from 1.9% in 2015 to 1.3% in 2024. Given average listed prices in 2024 (€395,247), each BER grade increase raises listed prices by €5,138 (1.3%). If the EE rises from a G to an A2 BER, the listed price would rise €66,794 (thirteen BER grade increases, each raising price by €5,138). The average BER improvement carried out in Ireland is from a D2 to an A2 (SEAI, n.d.), a nine BER-grade improvement, which according to our analysis would be capitalised into a property price premium of 11.7%, or €46,242 in 2024. We run the same analysis on transacted and listed prices. The final results indicate that the premiums using listed and transaction prices do not differ greatly and the trend over time moves in the same direction for this sample.
The Average Premium by Price Distribution
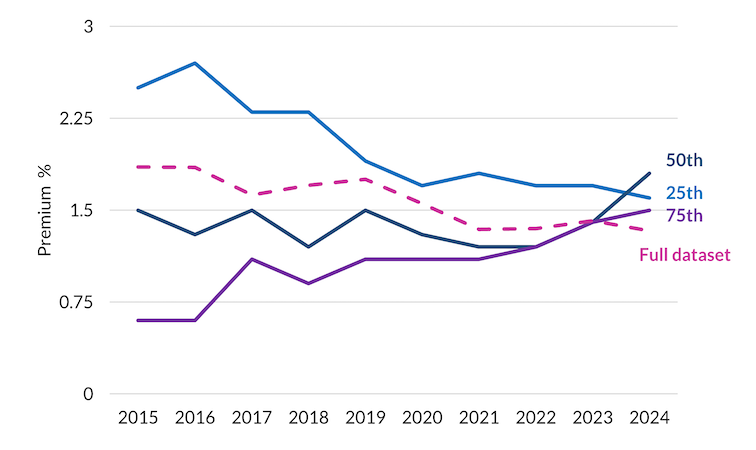
While the average premium has declined, this general finding masks different market segment trends. We estimate the premium at a low-, medium-, and high-price point (25th, 50th and 75th percentiles, respectively) of property valuations. The premium for the lower price point at the 25th percentile is higher than medium-priced or high-price properties. However, the premiums have been converging over time. At the lower price point, the premium declined from 2.5% to 1.6%. In the context of the average BER upgrade (D2 to A2), this equates to a reduction in the premium from 22.5% in 2015 to 14.4% in 2024. This market segment appears to be driving the main results (pink line).
In contrast, the premium increased for higher value properties (75th percentile) from 0.6% in 2015 to 1.5% in 2024. Therefore, for the average BER increase (D2-A2), the premium has increased from 5.4% in 2015 to 13.5% in 2024. The premium on medium-priced properties has remained relatively stable, albeit with an increase in 2023 and 2024. The increase in the premium at the top end of the price distribution may reflect the availability of high-EE properties among higher-priced listings.
The Premium for the 25th percentile has a Downward Trend Over the ten Years, While the Premium Slopes Upwards for the 50th and 75th Percentile
Figure 3: The Energy Efficiency Premium Between 2015 and 2024
Source: Own calculations using daft.ie data
Note: The pink line illustrates the results for the complete dataset, while the blue, navy and purple lines divide this dataset by price percentiles. The full dataset provides the average premium.
Accessibility: Get the data in accessible format. (CSV 1.59KB)
The Premium for BER Categories
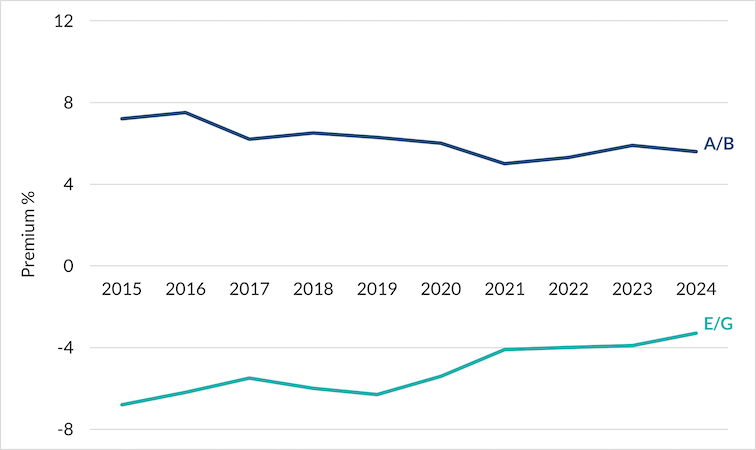
Relative to the benchmark group (C/D-rated properties), A/B-rated properties have a premium of 7.2% (average of 6.15% over the ten years), while E/G-rated properties are discounted by 6.8% in 2015 (average discount of 5.15%). The premium for efficient properties decreased from 7.2% to 5% between 2015 and 2021 and then rose slightly to 5.6% by 2024 (Figure 4). The discount for E/G-rated properties reduced over the period from 6.8% in 2015 to 3.3% in 2024.
Relative to C/D-rated Properties, A/B-rated Properties Have a Positive but Downward Trending Premium, Compared to a Negative Premium for E/G-rated Properties
Figure 4: Energy Efficiency Premium by BER category
Source: Own calculations using daft.ie data
Note: Figure 4 illustrates the premium for high EE properties (A/B) and low efficiency properties (E/G) relative to the benchmark group (medium EE properties). A/B-rated properties have a premium, while E/G-rated properties have a discount that is decreasing over time.
Accessibility: Get the data in accessible format. (CSV 3.48KB)
Policy Environment During Period of Study
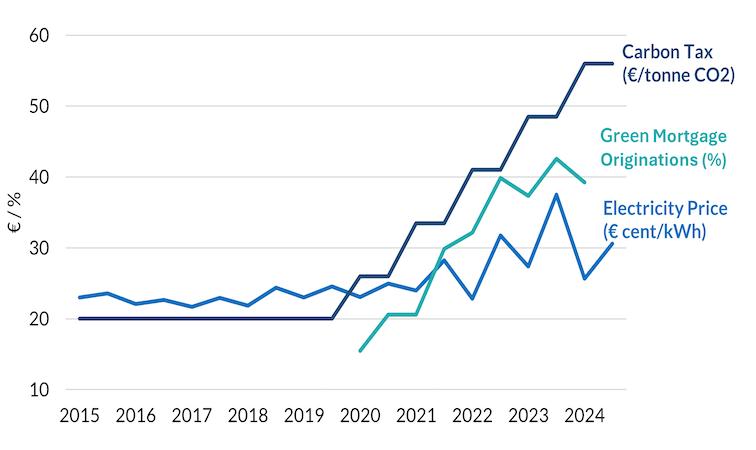
During our analysis period, there were a number of policy changes and external shocks which may have changed how EE is valued (Figure 5). For example, carbon taxes were introduced in Ireland in 2010 to encourage individuals and firms to invest in low-emission technologies. Rates have risen from €20 per tonne of carbon dioxide in 2019 to €56 per tonne in 2024, with commitments to raise it to €100 per tonne in 2030 (OECD, 2021; Parliamentary Budget Office, 2024). Furthermore, many Irish mortgage providers started providing lower green interest rates ("green mortgages") for energy efficient properties. Uptake has grown significantly since inception, rising from 15% of new originations in 2020 to just below 40% in 2024. Finally, energy prices rose sharply in 2022 following the military attack by Russia on Ukraine, with electricity prices increasing from 28.23 cent per KWh in 2021 Q4, to 37.48 cent per KWh in 2023 Q4 (SEAI, 2025). While we do not examine the relationship between these variables and the premium in this study, in-depth research on the role these are playing in determining the EE is a promising avenue for future work.
Figure 5: Carbon Taxes (€), Electricity Prices (€ cent), and Green Mortgage Originations (%)
Source: Central Bank of Ireland, 2024 (PDF 4.33MB); Parliamentary Budget Office, 2024; Sustainable Energy Authority of Ireland, 2025
Note: Half yearly and quarterly electricity prices are available from the SEAI (2025) and are expressed in cent per kWh, including VAT. Green mortgage originations refer to new mortgage loans for energy efficient properties that obtained a Green Rate discount. Green mortgage originations are obtained from the Central Bank of Ireland's 2024 Climate Observatory (PDF 4.33MB), which followed Lambert et al.'s (2023) (PDF 832.96KB) methodology. Carbon Tax data was obtained from the Parliamentary Budget Office (2024) and was written into legislation in 2019.
Accessibility: Get the data in accessible format. (CSV 0.55KB)
Conclusion
Our results indicate that there is an energy efficiency premium of 1.9% for each one-unit improvement a property's EE in 2015. The premium has declined over time from 1.9% in 2015 to 1.3% in 2024, with an average premium of 1.6% per BER unit improvement in this period. The change in the premium over the ten-year period depends on the market segment: more expensive properties have had an increase in their premium over the ten years, while lower-priced properties have had a decrease in their premium over time, marking a reduction in the importance of EE for lower-priced properties.
These results have relevance for the Central Bank of Ireland's supervisory and financial stability mandates, given the important role that property values play as collateral on residential mortgages. Variations in energy efficiency premiums across BER categories directly affect property collateral values and credit risk, with properties losing premium status facing potential market devaluation.
References
Billio, M., Costola, M., Pelizzon, L. and Riedel, M., 2022. Buildings' energy efficiency and the probability of mortgage default: The Dutch case. The Journal of Real Estate Finance and Economics, 65(3), pp.419-450.
Brounen, D. and Kok, N. (2011) 'On the economics of energy labels in the housing market', Journal of Environmental Economics and Management, 62(2), pp. 166-179.
Carroll, J., Denny, E., Lyons, R.C. and Petrov, I. (2024) 'Better energy cost information changes household property investment decisions: evidence from a nationwide experiment', Energy Economics.
Central Bank of Ireland (2024) Climate Observatory (PDF 4.33MB).
Central Bank of Ireland (2026) Frontier statistics: total domestic credit.
Central Statistics Office (2026) Domestic building energy ratings quarter 4 2025.
Daft.ie (2024) About.
Department of Climate, Energy, and Environment (2025) Government approves Climate Action Plan 2025.
Estévez, A. and Tovar-Reaños, M. (2026) Energy poverty and affordability in Ireland. [online] ESRI Survey and Statistical Report Series, 139.
Gillespie, T., Lyons, R., Carroll, J., and Ortega-McCormack, H. (no date). How much of the energy efficiency premium is real? Housing prices and the omitted quality bias. Unpublished.
Guin, B. and Korhonen, P. (2020). Does energy efficiency predict mortgage performance?. Bank of England Working Paper No. 852.
Hajnal, G., Palicz, A. and Winkler, S. (2022) 'Impact of energy rating on house prices and lending rates', Financial and Economic Review, 21(4), pp. 29–56.
Hyland, M., Lyons, R.C. and Lyons, S. (2013) 'The value of domestic building energy efficiency-evidence from Ireland', Energy Economics, 40, pp. 943–952.
Kahn, M.E. and Kok, N. (2014) 'The capitalization of green labels in the California housing market', Regional Science and Urban Economics, 47, pp. 25-34.
Kaza, N., Quercia, R.G. and Tian, C.Y. (2014) 'Home energy efficiency and mortgage risks', Cityscape, 16(1), pp. 279–298.
Kelly, D., Del Campo, A.G., Ryan, A., Collins, P. and Quigley, M. (2026) 'The Energy Divide: Linking Local Deprivation to Household Renewable Adoption', Energy.
Khazal, A. and Sønstebø, O.J. (2023) 'Energy efficiency premium issues and revealing the pure label effect', The Energy Journal, 44(1), pp. 33-54.
Kinnear, L. and Julienne, H. (2025) Energy poverty in Ireland Analysis of 2023 data from the Behavioural Energy and Travel Tracker. Sustainable Energy Authority of Ireland.
Lambert, D., Lyons, P. and Carroll, J. (2023) 'Going green: the growth in green mortgage financing in Ireland' (PDF 832.96KB), Financial Stability Notes, Central Bank of Ireland.
OECD (2021) 'A credible carbon tax trajectory for Ireland', IPAC Policies in Practice.
Parliamentary Budget Office (2024) Carbon tax series part 1 of 3: what is the carbon tax? House of the Oireachtas.
Pratschke, J. (2022) Pobal HP Deprivation Index \\[Dataset\]. Pobal Ltd.
Sanderford, A.R., Overstreet, G.A., Beling, P.A. and Rajaratnam, K. (2015) 'Energy-efficient homes and mortgage risk: crossing the chasm at last?', Environment Systems and Decisions, 35, pp. 157–168.
Stanley, S., Lyons, R.C. and Lyons, S. (2016) 'The price effect of building energy ratings in the Dublin residential market', Energy Efficiency, 9, pp. 875–885.
Sustainable Energy Authority of Ireland (2017) Behavioural insights on energy efficiency in the residential sector.
Sustainable Energy Authority of Ireland (2014) A guide to building energy rating for homeowners.
Sustainable Energy Authority of Ireland (2025) Average electricity price to households \[Dataset\].
Sustainable Energy Authority of Ireland (2026) Energy guidance for you and your home.
Sustainable Energy Authority of Ireland (2024) Guide to home energy updates.
Sustainable Energy Authority of Ireland (n.d.) National home energy upgrade scheme: One stop shop energy upgrades median costs and grants.
Sustainable Energy Authority of Ireland (2025) Sample BER Cert.
U.S. Environmental Protection Agency (no date) 'How ENERGY STAR Works', ENERGY STAR.
Taruttis, L. and Weber, C. (2022) 'Estimating the impact of energy efficiency on housing prices in Germany: does regional disparity matter?', Energy Economics, 105, 105750.
Walls, M., Gerarden, T., Palmer, K. and Bak, X.F. (2017) 'Is energy efficiency capitalized into home prices? Evidence from three US cities', Journal of Environmental Economics and Management, 82, pp. 104-124.
Endnotes