Measuring economic welfare
25 May 2023
Blog
When I talk to students, and especially those considering or just starting out on their discovery of economics, I often refer to the
discipline as Alfred Marshal did over a century ago as the “study of mankind in the ordinary business of life”. It happens to be the case that much of my professional career in the discipline has been applying it in organisations whose
purpose is to improve the lot of communities in the course of going about the ordinary business of life.
At the core of studying something is measurement. And as Nobel laureates Joseph Stiglitz and Amartya Sen noted in their work with French economist Jean-Paul Fitoussi over a decade ago, what we measure matters. It affects what we do. If we don’t measure the right thing, we won’t be able to do the right thing. This is
never far from the mind of those of us interested in improving the economic welfare of communities as they go about the ordinary business of life.
When it comes to measuring economic welfare there are two broad aspects I think that we have to consider. First, how do we go about capturing the “ordinary business of life” in a meaningful and measurable way? Second, how do we compare or
benchmark those measures across communities and across time to show where improvements can be made?
Addressing both of these aspects is no easy task, and at a minimum requires consistent frameworks covering multiple dimensions. With the
UN Sustainable Development Goals (SDGs) and the OECD Wellbeing Framework,
focus has been placed on policy-relevant economic analysis capturing measurements of people’s lived experience across a number of areas including health and housing, environment, education, work patterns and standards and sense of community
connection. Ireland has adapted both the SDGs and a wellbeing framework to inform domestic policy,
with comparable measures published regularly by the Central Statistics Office (CSO) (and in New Zealand such a framework/indicators are being used to support economic policymaking and resource allocation).
At the heart of these initiatives is bridging the gap that can sometimes be perceived between big picture macro aggregates, like GDP, inflation or unemployment, and the day-to-day experience of households and businesses. This also stretches into the measurement
of things core to a central bank’s objectives of price and financial system stability. For example, an important outcome of the ECB’s strategy review (PDF 545.22KB), concluded in 2021, was that the Governing Council will
take account of the cost of owner-occupied housing when assessing price pressures. This would better reflect people's experience of inflation, which was a clear message we heard at public consultations during the review process. Over time, and as decisions are made on the issue by the European Statistical System, a roadmap has been laid out for how to include these costs in our target measure of inflation.
In addition, to understand how monetary policy achieves price stability, and how macroprudential policy promotes financial stability, greater attention is being paid to the diverse characteristics of households across the economy. By looking at more granular
data, such as what is available in the ESCB Household Finance and Consumption Survey or the Household Budget Survey (PDF 237.71KB), economists have been able to show how the differences in wealth, incomes and consumption patterns across households result in different effects of inflation (PDF 237.71KB). Similarly, understanding households along these
dimensions also allows us to understand the effect of inflation and interest rate changes on their levels of financial resilience. (PDF 676.87KB)
A great benefit in some of the multi-country survey-based data is the consistency they can bring in measurement. Not only can they bring the analysis closer to the lived experience of households within a particular region or country, they can often allow
some comparison on a “Iike-for-like” basis across regions and countries. Understanding the possible differences along the different regional and national settings can be particularly important when we think about how those things
intertwine with the single monetary policy for the whole euro area, for example.
The long-standing framework for comparing economic welfare across countries and across time is the System of National Accounts, and this will remain the bedrock of macroeconomic analysis. The framework itself evolves over time, as the nature of economies, technology
and degree of interconnectedness changes. There have been six significant updates since it was first established as an international standard in 1947, with another one expected in 2025.
One of the challenges with interpreting some of the headline indicators from the national accounts is the perceived distance between Gross Domestic Product or Gross National Income and the lived experience of households and businesses. This is the case
in all countries, and is in some ways unavoidable. The very process of adding up the income accruing to all the types of economic actor, whether they be supplying labour or capital, adding in the role of government, cross-border trade
and foreign investment, as well as myriad other factors, is complex. Measured growth in national account aggregates is associated with increased living standards across societies over time, which is why they are important to monitor and understand. However, there does not seem to be anything intrinsic in the process that leads to a narrower distribution of living standards within societies at a given point in time. So for the individual household or business, the reference points for their own comparison of how they are faring may be a bit blurred.
In addition, there are peculiarities that can arise given the structure of individual economies, such as their exposure to trends in globalisation (or interconnectedness), which can further exacerbate the distance between headline national accounts data
and the experience of most households and business, as well as making cross-country comparisons less straightforward. Ireland has been an example of these challenges for decades, and especially so since 2015.
Since then, a combination of changes in the business models of some MNEs based in Ireland along with changes in the way certain MNE activities are measured has led to measured economic activity growing substantially. From 2014 to 2022, the Irish economy
as measured by real GDP more than doubled, having grown by 114 per cent, whereas euro area GDP grew by 13 per cent over the same period. As a result, Irish GDP now accounts for almost 4 per cent of total euro area GDP, having been just below 2 per
cent in 2014. When you factor in population growth over the years since 2014, real GDP per capita has increased by almost 95 per cent in Ireland, bringing it to well over double the total euro area per capita GDP, and second only behind Luxembourg.
The underlying reasons for this, mostly related to intellectual property investment by MNEs in Ireland, can have a material impact on overall euro area business investment in the periods that the investment takes place, as well as on the extent of export growth in subsequent periods.
Obviously, such scale of increase in GDP is well beyond the day-to-day experience of most in the Irish economy. However, at the same time, when we look at measures of household and business resilience, or developments in the labour market, we see marked
improvements in the Irish economy since 2014, exceeding those of the euro area. By 2022, for example, 78.2 per cent of the population in Ireland was in employment, an increase of 10 percentage points over the period, whereas the figure for the euro
area overall increased by just over 6 percentage points to 74.1 per cent. Actual individual consumption on a per capita basis rose by 11.6 per cent from 2014 to 2022 (8.1 per cent for the euro area overall), with Ireland ranking 7th in the euro area
on this measure last year, having been 8th in 2014. So, overall, the Irish economy has been performing well over the pastdecade, and has shown resilience in light of the overlapping shocks since 2020 of the COVID-19 pandemic and Russia’s war against Ukraine and its people.
In response to the challenges that globalisation presents to interpreting the Irish national accounts, the CSO has produced additional headline indicators to aid understanding of developments, bringing them closer to the day-to-day reality of households
and businesses. Modified Gross National Income (GNI*),
for example, removes certain elements of globalisation related to the ownership of intellectual property, aircraft and other assets by foreign-owned MNEs in Ireland. As a result it captures in a better way than GDP the income generated by the domestic
economy. To better reflect the level of expenditure in the domestic economy, the CSO also publishes Modified Domestic Demand, which excludes the expenditure on aircraft and intellectual property assets. Both these measures are closer to the tangible experience of households and businesses in the Irish
economy, which is clearly the case when compared to developments in employment (see chart). Since they are more relevant in understanding economic conditions domestically, they are also the indicators we focus on in our own regular analysis in the
Quarterly Bulletin.
Chart: GDP, GNI*, MDD and Employment
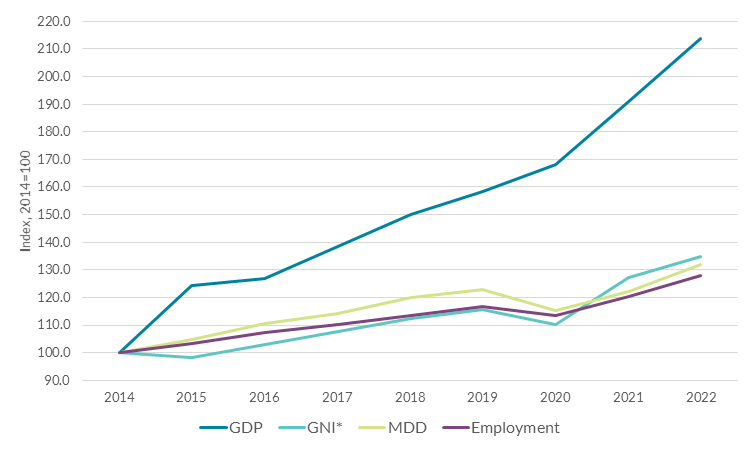
Source: CSO, Central Bank of Ireland estimates (GNI* in 2022)
While these additional metrics from the national accounts are particularly appropriate in the Irish context, the challenges they try to address are fundamental to the wider international framework, something that is gaining increased attention amongst
statisticians and economists. Alongside the issues of globalisation, other factors such as better capturing the value of the environment and unpaid care work in the system of national accounts have also been discussed. As in the past, advances
in the international standards for national accounts will hopefully, over time, lead to more readily comparable measures that better capture the “ordinary business of life” as it is perceived by households and businesses on a day-to-day
basis. However, they will only ever be one facet of the multi-dimensional data and analysis needed to fully understand developments in the economic welfare of our communities and, ultimately, what we value and prioritise.
Gabriel Makhlouf
Read more: