Key Insights
In response to the 2023 recalibration of Loan-to-Income limits first-time buyers increased their mortgage borrowing which resulted in broader market access, with younger and lower-income borrowers improving their ability to purchase a property.
There were noticeable differences in the response across regions. In supply-constrained Greater Dublin, middle-income borrowers purchased more expensive homes and reduced consumer borrowing. Elsewhere, borrowers reduced downpayments whilst maintaining unsecured credit access, suggesting less binding constraints.
The findings highlight the importance of understanding regional heterogeneous impacts, as regional conditions can shape how changes in national macroprudential policy affect household behaviour.
Introduction
The Central Bank of Ireland introduced borrower-based mortgage measures in 2015 to ensure sustainable lending standards and prevent the emergence of an unsustainable relationship between credit and house prices. These measures include limits on how much households can borrow relative to their income (LTI) and the value of the property (LTV). In January 2023, following a comprehensive review, the Central Bank recalibrated its mortgage measures, increasing the loan-to-income (LTI) limit for first-time buyers (FTBs) from 3.5 to 4 times annual income. Whilst the measures had successfully improved credit quality and borrower resilience, the Central Bank recognised that the economic costs of the measures had increased since 2015, primarily due to structural developments that led to persistently higher house prices relative to household incomes.
Ireland's 2023 recalibration sought to preserve financial stability benefits of the measures, while ensuring continued, appropriate credit access for those seeking to enter the housing market. The recalibration offers a valuable opportunity to understand these trade-offs. Extensive research exists on the effects of tightening borrower-based measures (Acharya et al., 2022; Peydró et al., 2023; Van Bekkum et al., 2024), but evidence on increasing a lending limit is scarce.
This Staff Insight synthesises findings from Singh and Yao (2025) and new evidence from Singh, Stradi and Yao (2026), which examines the relationship between LTI recalibration and unsecured consumer borrowing using Central Credit Register data. Our analysis reveals two key findings: firstly, the policy changes expanded market access for younger and lower-income borrowers. Secondly, borrowers' responses varied significantly based on local housing market conditions and their existing financial positions—borrowers in Great Dublin Area (GDA) purchased more expensive homes while reducing personal loan borrowing, borrowers outside GDA deployed their additional borrowing capacity to reduce downpayment with no change in unsecured credit.
The 2023 Recalibration
Following a comprehensive review of the mortgage measures framework in 2021-2022, the Central Bank concluded that, while the measures had operated as intended, a targeted recalibration was appropriate to better balance their benefits and costs. The review noted that house prices had risen faster than incomes, and access to the home ownership had become increasingly difficult for a larger cohort of households. For FTBs, this resulted in raising the LTI limit from 3.5 to 4, while maintaining the LTV ceiling at 90 per cent. The change took effect on 1 January 2023.
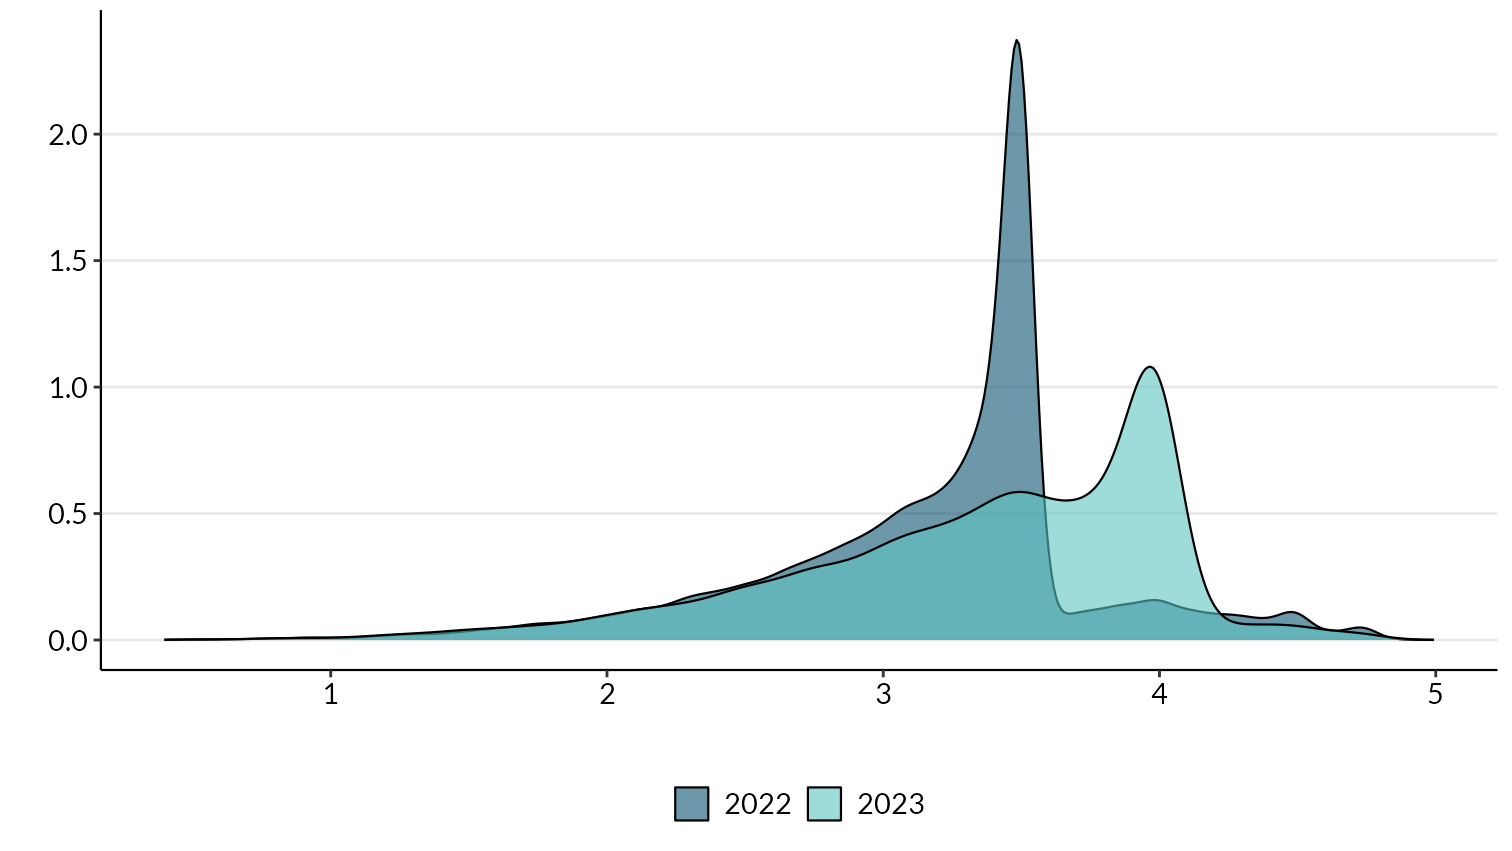
The LTI Distribution Exhibited Sharp Bunching at the 3.5 Threshold Pre-Policy Reform, Reflecting Binding Borrowing Constraints for a Substantial Share of Borrowers
Figure 1: LTI Distribution of FTBs Between 2022 and 2023
Source: Monitoring Templates Data, Central Bank of Ireland (confidential dataset).
Note:This figure plots the distribution of loan-to-income (LTI) ratios for first-time buyers at mortgage origination in 2022 and 2023. Dashed lines represent the LTI limit for FTBs at 3.5 in 2022 and 4.0 in 2023. A certain proportion of lending over the limits (exemptions/allowances) is allowed. The x-axis represents the LTI ratio (ranging from approximately 2.0 to 4.5) and the y-axis represents the density or frequency of mortgages at each LTI level.
Accessibility:In the chart, we use a histogram to show the shifts in the distribution of LTI ratios for first-time buyers before and after the January 2023 recalibration of the loan-to-income limit. These plots are based on individual mortgage data from confidential datasets - Monitoring Templates data - of the Central Bank of Ireland. They show that, in 2022, there was sharp bunching of new mortgages at the 3.5 times LTI limit, indicating that this threshold was a binding borrowing constraint for a substantial share of borrowers. By 2023, following the policy recalibration that increased the FTB limit to 4.0, the distribution of new lending had shifted markedly. The concentration of mortgages previously clustered at 3.5 moved to the new 4.0 limit, demonstrating that first-time buyers actively utilised the additional borrowing capacity made available through the recalibration. This bunching at the new limit indicates that borrowers sought the expanded credit access, whilst some lending above the limits through allowances is visible in both periods.
In the period before the LTI easing, there was a concentration of FTB mortgages at the 3.5 LTI threshold - evidence that the limit was binding for many prospective homeowners. However, as illustrated in Figure 1, there was a clear shift in the LTI distribution following the LTI recalibration. FTBs made use of the additional credit available to them with their concentration shifting markedly from the old 3.5 to the new 4.0 limit, indicating that borrowers actively sought the expanded borrowing capacity.
Trends in Real Estate Prices and Credit Growth
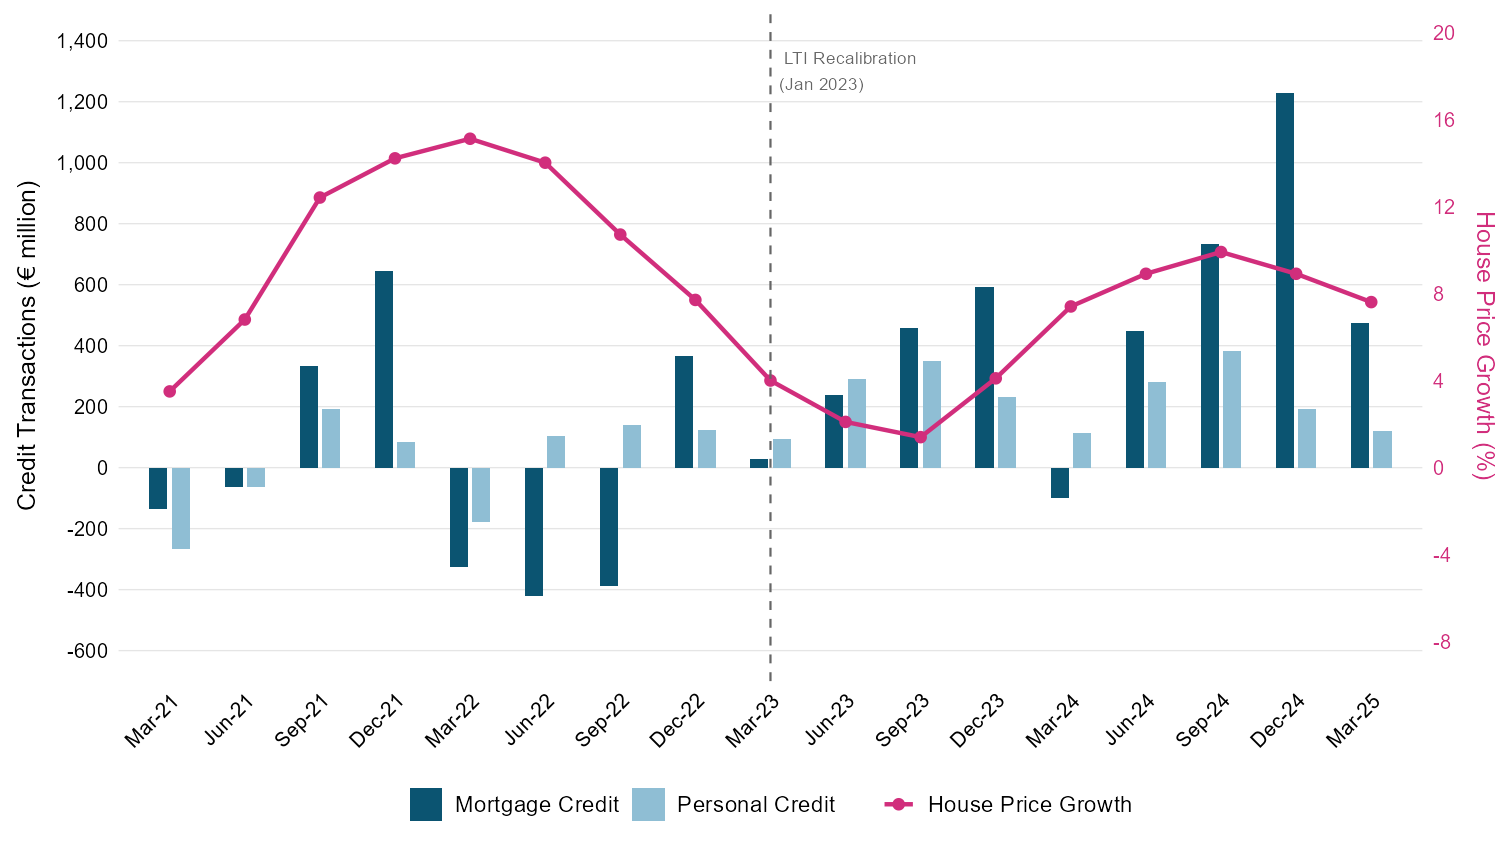
In the years around the policy change, Irish housing and credit markets experienced significant developments. House prices demonstrated strong growth, driven primarily by supply constraints, whilst mortgage and personal credit flows showed considerable volatility reflecting broader economic conditions, including an increase in interest rates following the inflationary pressures arising from the pandemic and Russia/Ukraine shocks. Figure 2 presents annual percentage changes in mortgage as well as personal credit, and the growth rate in house prices around the recalibration period, providing context for the market conditions in which the policy change occurred.
Mortgage Credit Consistently Expanded and Grew After LTI Easing, with Continued House-Price Volatility as Well Expansion in Consumer Credit
Figure 2: Irish Housing Price and Household Credit Developments, 2021-25
Source: Private Household Credit and Deposits, Central Bank of Ireland and Residential Property Price Index (HPM09), Central Statistics Organisation.
Note: Credit series (mortgage and personal) represents transactions in each period calculated as difference in outstanding amounts from previous period. Credit series cover banks and credit unions only, excluding non-bank lenders. Transactions are the net change in household debt balances due to new lending (+) and debt repayments (-). Nominal House Price Growth is the percentage change over 12 months in Residential Property Price Index.
Accessibility: Get the data in accessible format (CSV 0.44KB).
The data show house price growth remained positive throughout the period, though volatile. Mortgage credit flows were particularly volatile in 2022, turning positive and expanding consistently from 2023 onwards. Personal credit also increased during this period. Understanding which of these trends reflect the policy recalibration—and which reflect broader economic factors—requires careful analysis of how different borrower groups and regions actually responded.
Regional Differences in Housing Conditions
Housing supply constraints and strong real-estate price growth were evident across Ireland ahead of the recalibration, but there were also regional differences with tighter supply constraints in some parts of the country. Evidence from the Central Bank (2024 (PDF 1.09MB)) shows that the GDA—encompassing Dublin and commuter counties of Meath, Wicklow and Kildare—lacks sufficient zoned and serviced land relative to its young population, creating a supply-constrained market. In contrast, regions outside the GDA have more elastic housing supply where it is cheaper to build lower-density housing (Günnewig-Mönert and Lyons, 2024).
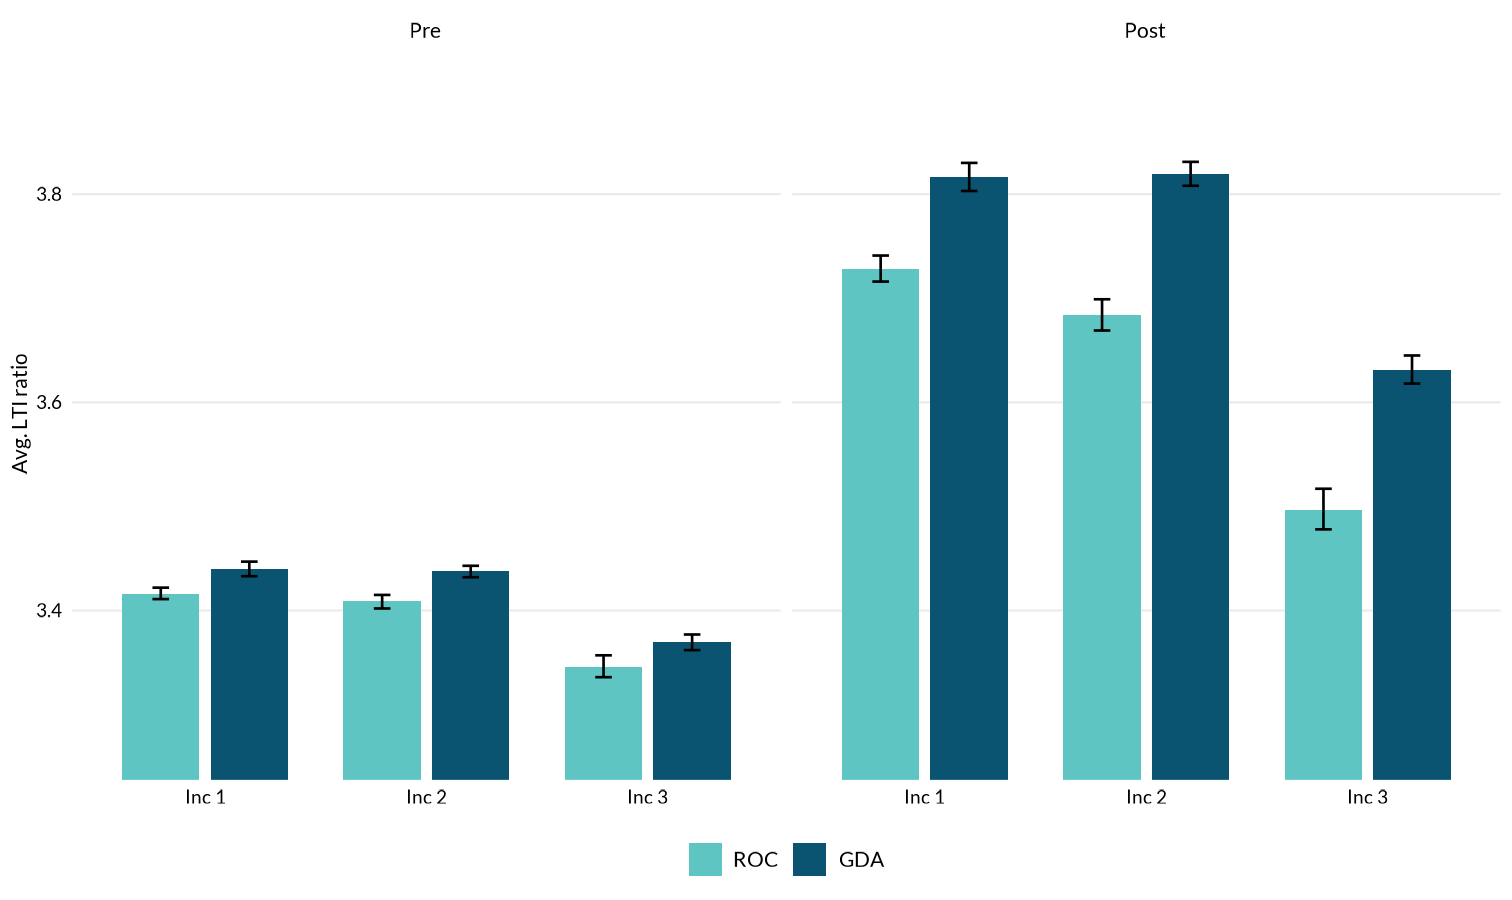
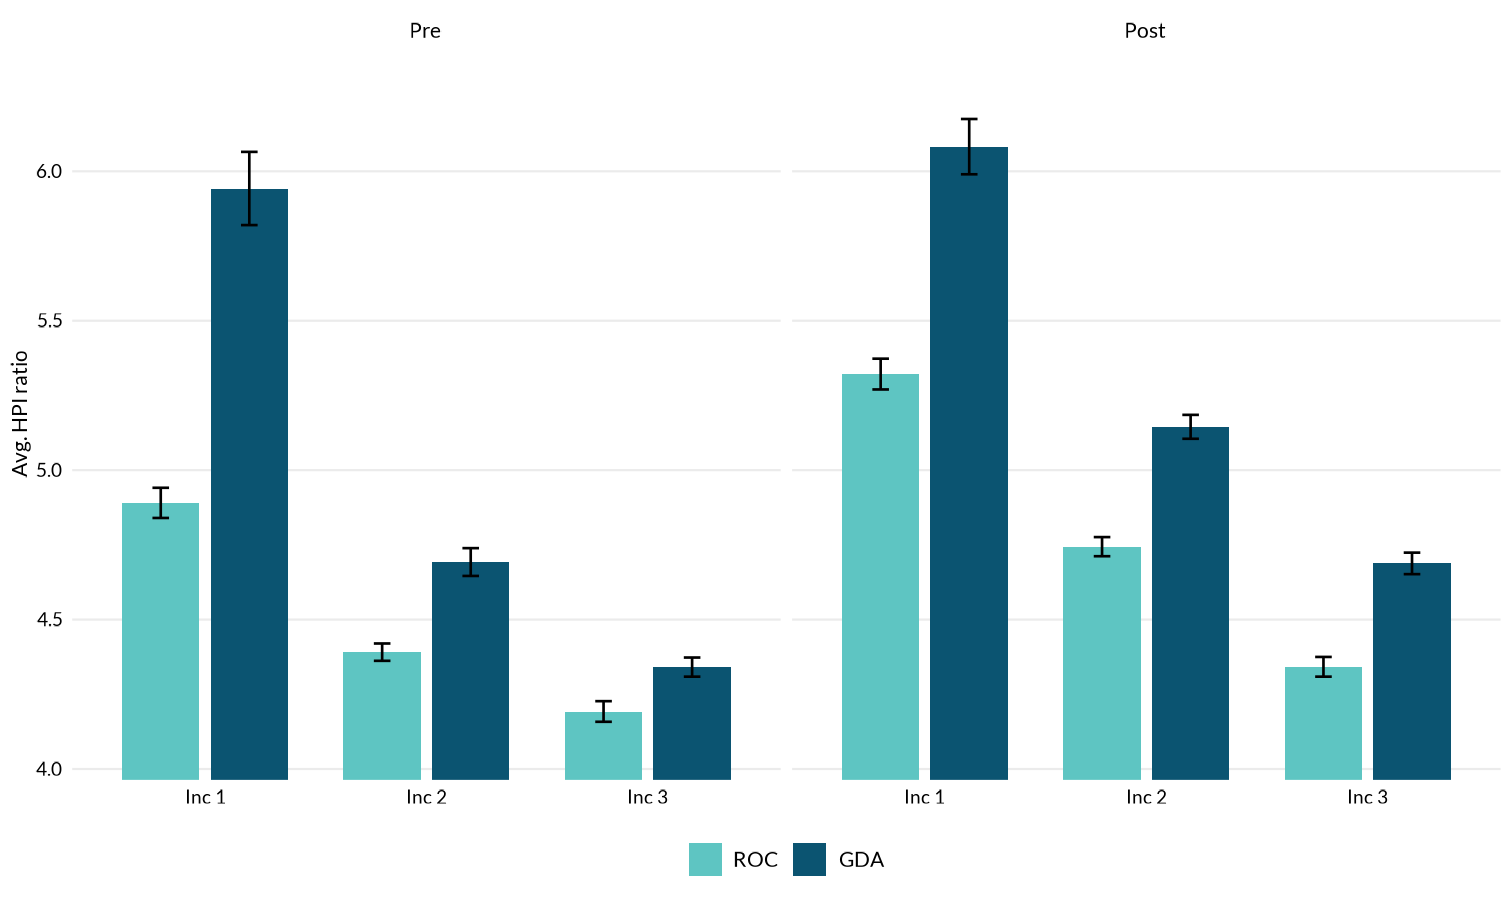
The divergence in regional housing conditions, as well as the financial positions of borrowers, could shape borrowers' responses to the 2023 recalibration. For example, Figure 3.1 shows that compared to borrowers in the rest of the country, those in the GDA had LTI ratios persistently closer to the limit across all income groups, both before (3.5x) and after (4.0x) the policy change. Similarly, in Figure 3.2, house price-to-income ratios have been persistently higher in the GDA. Given that borrowers in GDA borrow relatively closer to the allowable limit of housing credit as well as consistently depict significantly higher house price to income ratios, this can potentially reflect, at least in part, tighter credit constraints and elevated cost of housing for GDA borrowers relative to their ROC counterparts.
Borrowers Across all Income Quantiles in GDA Demonstrate High Mortgage Credit Relative to Income in Both Pre and Post LTI Recalibration Periods
Figure 3.1: Loan-to-Income (LTI) Across Three Income Quantiles in Greater Dublin Area (GDA) and Rest of the Country (ROC)
Source: Monitoring Templates Data, Central Bank of Ireland.
Note: Borrowers across all income quantiles in GDA also demonstrate high house purchase value relative to income in both pre and post LTI recalibration periods.
Accessibility: Get the data in accessible format (CSV 0.51KB).
Borrowers Across all Income Quantiles in GDA Also Demonstrate High House Purchase Value Relative to Income in Both Pre and Post LTI Recalibration Periods
Figure 3.2: House price-to-income (HPI) Across Three Income Quantiles in Greater Dublin Area (GDA) and Rest of the Country (ROC)
Source: Monitoring Templates Data, Central Bank of Ireland.
Note: The CI-bar plot presents mean values of HPI with whiskers representing 95% confidence interval.
Accessibility: Get the data in accessible format. (CSV 0.51KB)
Methodology and Data
Our analysis uses detailed mortgage data from the Central Bank's Monitoring Templates (MTD) and Central Credit Register (CCR), covering the period from 2022 to mid-2024. We employ a difference-in-differences (DiD) approach to isolate the effects of the policy change from broader economic trends, comparing FTBs, who were affected by the LTI change, with second and subsequent buyers (SSBs), who were not affected. The sample includes 24,694 borrowers: 20,052 FTBs in the treatment group and 4,642 SSB in the control group. This approach allows us to identify causal effects by comparing changes in outcomes between these groups before and after the policy implementation on 1 January 2023.
Overall Effects: More Credit, Quality Upgrades, and Broadened Access
We find that, on average, the LTI recalibration increased mortgage borrowing by approximately 8.6 per cent for borrowers who were most constrained by the previous limit. This translated into a roughly 5 per cent increase in the value of homes purchased by these FTBs. Importantly, this increase in housing value did not come from buyers purchasing larger properties.
Interestingly, borrowers were 5 percentage points (p.p.) more likely to purchase newly constructed homes—this result being primarily driven by lower income FTBs in the sample. This evidence suggests that the additional borrowing capacity may have been used to access better quality or more energy-efficient dwellings rather than simply expanding floor area. This result may be an upper estimate of the true outcome as it may be partly attributable to the Help to Buy (HTB) subsidy available to FTBs on purchase of newly constructed dwelling. It is likely that FTBs combined increased credit availability with HTB support towards home ownership, thus driving the purchase of newly constructed dwellings.
Beyond credit expansion, the policy successfully broadened access to the housing market for groups that typically face greater barriers to entry. The share of younger first-time buyers increased by approximately 4 to 5 p.p. following the policy change. Similarly, there was a comparable increase in the proportion of lower-income borrowers entering the market. These shifts were balanced by corresponding declines in the shares of older and higher-income entrants. These findings suggest that easing the LTI limit enabled younger households and those with lower income to accumulate the necessary downpayments more quickly and enter the market sooner than they otherwise would have. This result re-enforces the important role played by exemptions/allowances in facilitating entry for affordability constrained borrowers before the LTI recalibration.
Local Conditions and Borrower Response
While these results indicate that the recalibration reduced costs of the measures via greater access to housing, it could also have altered benefits of the policy by affecting household borrowers' financial vulnerability in future periods. This is the conventional trade-off associated with borrower-based policies.
At an aggregate level, the policy recalibration increased mortgage borrowing and maintained broad access to the mortgage market across borrower cohorts, but this result masked how the measures may have an uneven effect across different groups. To address this, we conducted heterogeneity tests across regions and borrower income cohorts. Our analysis reveals that households' reactions can vary significantly and may be understood through the lens of two regional characteristics: constrained housing supply and tighter pre-existing borrowing constraints among GDA borrowers.
Greater Dublin Area (GDA): Inelastic Supply, Concentrated Leverage
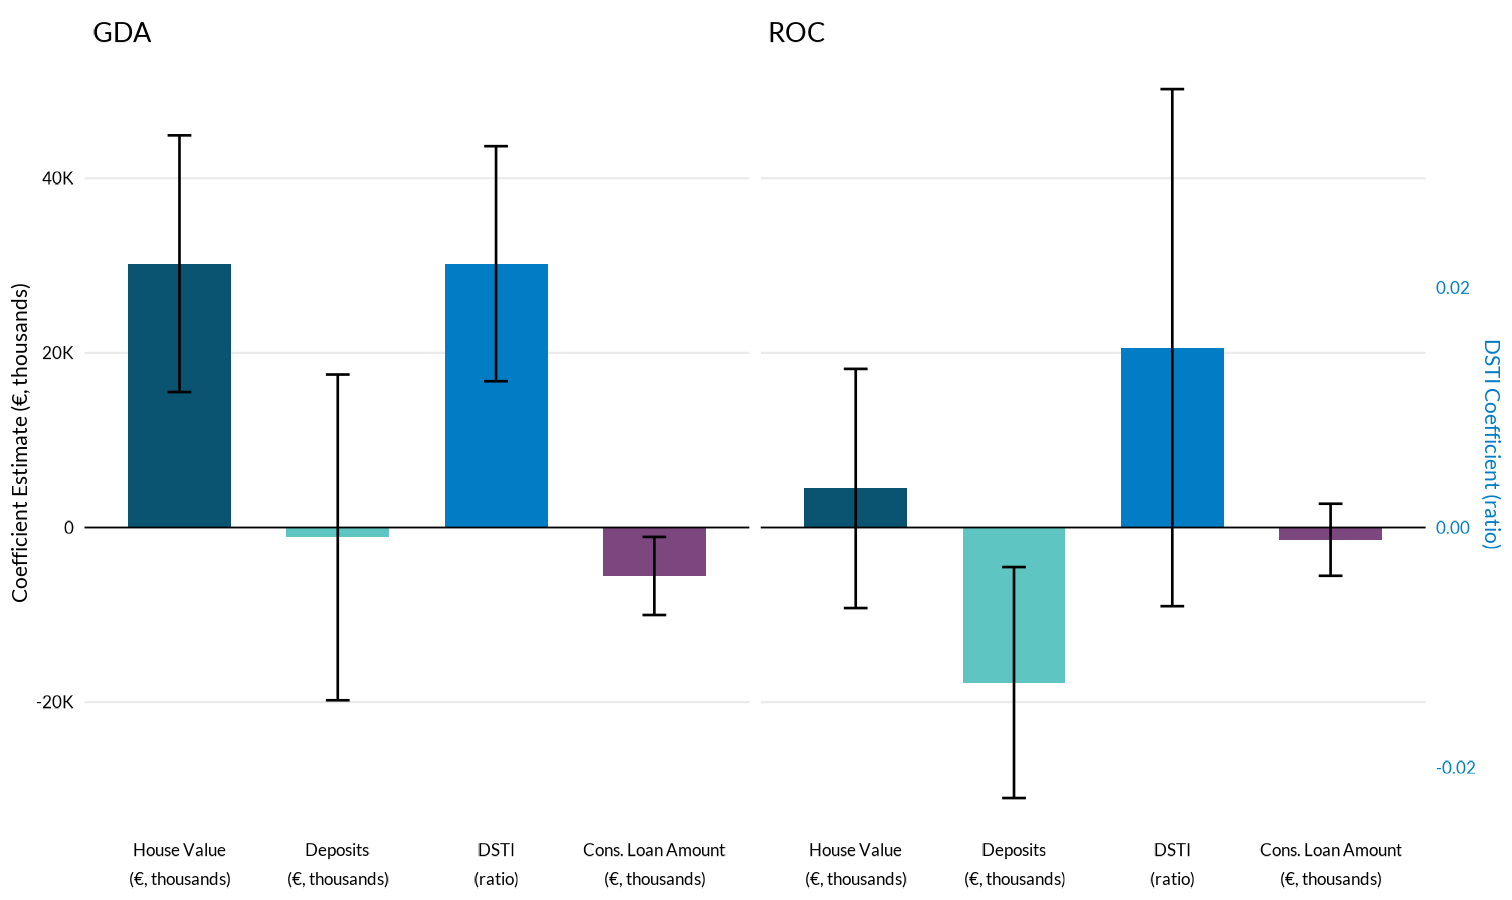
With limited housing supply in the GDA, the evidence suggests that additional credit was directed towards higher purchase prices. As a result of the policy easing, the value of houses purchased by our sample of affected middle-income FTBs in the GDA increased by approximately €30,200 (8.7 per cent above pre-policy levels).
The limited availability of homes relative to prospective buyers, combined with new construction that has not kept pace with demand, contributes to the pressures observed in the GDA. Notably, middle-income first-time buyers in the region face tighter borrowing constraints than their counterparts elsewhere in the country (as demonstrated by average LTI ratios closer to the 3.5x limit in Figure 3.1 top-left panel), reflecting both supply-side limitations and the higher price points required to enter the market. In this environment, we find that these borrowers have used their additional lending capacity to purchase more expensive homes and could not reduce the value of their housing downpayment (Figure 4).
We also find that total debt-service-to-income (DSTI) ratios for these borrowers increased materially following the policy change, reflecting the larger mortgage payments required for higher-value properties. In addition, GDA middle-income borrowers reduced other forms of borrowing, such as personal loans and car finance - a pattern evident in Figure 4 by the negative coefficient in consumer loan amounts.
This behaviour may be consistent with what economists term a "debt-overhang" mechanism (Mian and Sufi, 2015; Becker and Shabani, 2010). When households assume substantial mortgage debt, they typically become more cautious about additional borrowing and protecting financial resilience. The fact that GDA borrowers reduced consumer borrowing suggests they may have been cognisant of the implications of their increased mortgage obligations, although tighter supply constraints from consumer lenders could also have been a factor.
Middle-Income Borrowers in GDA Used Enhancement in Mortgage Credit Towards Increased Housing Expense—Simultaneously Increasing DSTI and Reducing Consumer Loans. Outside GDA, Expansion in Mortgage Credit Led to Liquidity Enhancement Through Reduction in Downpayment
Figure 4: Heterogeneous Effects of LTI Recalibration for Middle-Income Borrowers: GDA vs ROC (point estimates with 95% confidence intervals)
Source: Monitoring Templates Data, Central Bank of Ireland.
Note: Point estimates are regression coefficients of the difference-in-difference parameter. Each result (housing value, downpayments, DSTI, etc.) is a separate regression in GDA and ROC.
Accessibility: Get the data in accessible format. (CSV 1.03KB)
Rest of Country (ROC): Elastic Supply, Liquidity Preference
Our analysis of ROC borrowers reveals a different pattern of outcomes following the LTI policy recalibration. In these regions, borrowers appeared able to purchase a property without using the additional credit on a more expensive home — this meant that they could reduce their upfront cash downpayment. As evident in the coefficient plot in Figure 4, with credit easing, middle-income borrowers purchased properties of similar value to their control counterparts (SSBs at 3-3.5 LTI), despite increasing mortgage amounts. Given relatively more elastic housing supply in these regions, the evidence suggests that additional credit was absorbed primarily through reduced downpayment requirements rather than facilitating higher purchase prices.
Unlike their GDA counterparts, ROC borrowers did not reduce their consumer borrowing in response to higher mortgage debt - increases in total DSTI ratios in the ROC were modest and not statistically significant (0.016 percentage points for middle-income borrowers) following the policy change.
This behaviour may be consistent with what economists term a "liquidity preference" or "precautionary saving" motive (Carroll, 1997; Lusardi, 1998; Kaplan and Violante, 2014; McCann and Singh, 2025). Households value having a financial buffer to insure against unexpected expenses and income shocks, or to use on non-mortgage expenses. By reducing their downpayment requirements, borrowers in the ROC appear to have improved their short-term liquidity position and have not significantly increased the value of properties purchased. Additionally, the fact that ROC borrowers maintained consumer borrowing suggests they may not have perceived themselves as over-leveraged, or faced tighter unsecured credit constraints, following the policy change.
In contrast to the GDA, where constrained supply channelled additional credit into higher purchase prices, credit easing in ROC appears to provide greater flexibility among middle-income households without proportional increases in financial vulnerability. By reducing downpayment requirements whilst maintaining access to consumer credit, these borrowers were able to maintain a savings buffer. The insignificant change in DSTI ratios, combined with sustained access to instalment and revolving credit, suggests that borrowers in supply-elastic markets operated under less binding financial constraints than their GDA counterparts.
Policy Implications: Understanding Trade-Offs
These findings highlight an important consideration for macroprudential policy design: the same policy can produce different outcomes depending on local economic conditions (Greenwald and Guren, 2025).
The 2023 LTI recalibration successfully broadened access to mortgage credit for younger and lower-income borrowers and gave borrowers in less supply-constrained markets the flexibility to reduce their downpayments. These represent policy achievements, while recognising that some borrowers increased their DSTI and took on more debt to afford higher house prices in supply-constrained markets.
Importantly, this occurs within the borrower-based macroprudential framework we have in place. As shown in previous Central Bank analysis (Singh and Yao, 2025),debt burdens so far remain at manageable levels from a system-wide perspective. Moreover, the Central Bank has outlined that it will continue to assess these measures and acknowledges the critical role of allowances to provide flexibility in lending over the LTI and LTV limits in certain circumstances (see Mortgage Measures - FAQ).
The findings in this Insight could support future assessments across several dimensions:
- Granular monitoring of regional and financial constraints can highlight where the costs and benefits are balanced differently. This perspective can reveal trade-offs that aggregate analysis might obscure, and shows the importance of flexibility in the framework through allowances.
- Easing credit constraints does not always lead to further pressure on transaction values. Where structural factors allow, some borrowers will choose to preserve liquidity rather than buy a more expensive property.
- Complementary policies addressing housing supply can strengthen benefits of the measures. Addressing underlying supply constraints is ultimately a complex challenge requiring sustained effort across multiple policy domains and stakeholders, but if achieved, the evidence in this Insight suggests that it can alleviate some policy trade-offs.
Conclusion
The Central Bank recalibrated the LTI limit in January 2023, and in this Insight we show how credit constraints and regional housing market conditions shaped borrower behaviour. The findings suggest that the impact of macroprudential policy can vary based on regional conditions, thus highlighting the importance of allowing flexibility in the framework through the allowances.
In supply-constrained markets like the GDA, credit easing translated into higher house prices and leverage among middle-income households. In supply-elastic regions, the same policy enabled borrowers to improve financial flexibility by reducing housing downpayments. Across both regions, younger and lower-income borrowers gained greater access to the mortgage market.
These outcomes underscore the importance of understanding regional disparities and borrower financial constraints when assessing the impact of national macroprudential policies. The interplay between housing supply elasticity and pre-existing borrowing constraints appears to shape some outcomes, though the precise causal mechanisms warrant further investigation.
References
Acharya, V. V., Bergant, K., Crosignani, M., Eisert, T., and McCann, F. (2022). The anatomy of the transmission of macroprudential policies. The Journal of Finance, 77(4), 2201–2245.
Becker, B., and Shabani, M. (2010). Outstanding debt and the household portfolio. The Review of Financial Studies, 23(7), 2900–2934.
Carroll, C. D. (1997). Buffer-stock saving and the life cycle/permanent income hypothesis. The Quarterly Journal of Economics, 112(1), 1–55.
CBI (2024). Quarterly bulletin 3 signed article: Economic policy issues in the Irish housing market. Technical report, Central Bank of Ireland.
Greenwald, D. L., and Guren, A. (2025). Do credit conditions move house prices? American Economic Review, 115(10), 3559–3596.
Günnewig-Mönert, M., & Lyons, R. C. (2024). Housing prices, costs, and policy: The housing supply equation in Ireland since 1970. Real Estate Economics, 52, 1075–1102.
Kaplan, G., and Violante, G. L. (2014). A model of the consumption response to fiscal stimulus payments. Econometrica, 82(4), 1199–1239.
Landvoigt, T., Piazzesi, M., and Schneider, M. (2015). The housing market (s) of San Diego. American Economic Review. 105(4):1371–1407.
Lusardi, A. (1998). On the importance of the precautionary saving motive. The American Economic Review, 88(2), 449–453.
McCann, F., and Singh, A. P. (2025). Liquidity and leverage responses to mortgage downpayment subsidies. Real Estate Economics.
Mian, A., and Sufi, A. (2015). House of debt: How they (and you) caused the Great Recession, and how we can prevent it from happening again. University of Chicago Press.
Ortalo-Magne, F. and Rady, S. (2006). Housing market dynamics: On the contribution of income shocks and credit constraints. The Review of Economic Studies, 73(2):459–485.
Peydró, J.-L., Rodriguez-Tous, F., Tripathy, J., and Uluc, A. (2023). Macroprudential policy, mortgage cycles, and distributional effects: Evidence from the United Kingdom. The Review of Financial Studies, 37(3), 727–760.
Singh, A. P and Yao, F. (2025). Household Resilience to Current Income and Cost-of-Living Shocks. Staff Insight, Vol 2025, No.10, Central Bank of Ireland.
Singh, A. P., and Yao, F. (2025). Macroprudential loosening and mortgage borrower outcomes: Evidence from Ireland. Research Technical Paper, Vol 2025, No.13, Central Bank of Ireland.
Singh, A. P., Stradi, F. and Yao, F. (2026). Macroprudential loosening and mortgage borrower outcomes: Evidence from Ireland (mimeo).
Van Bekkum, S., Gabarro, M., Irani, R. M., and Peydró, J.-L. (2024). The real effects of borrower-based macroprudential policy: Evidence from administrative household-level data. Journal of Monetary Economics, 147, 103574.
van der Drift, R., de Haan, J., and Boelhouwer, P. (2023). Mortgage credit and house prices: The housing market equilibrium revisited. Economic Modelling, 120:106136.
Endnotes
Disclaimer
This Staff Insight summarises research by Anuj Pratap Singh, Francesco Stradi, and Fang Yao of the Central Bank of Ireland's Macro Financial Division. The views expressed are those of the authors and do not necessarily represent the official views of the Central Bank of Ireland or the European System of Central Banks. We accept full responsibility for any errors or omissions.