Labour market dynamics and the inflation outlook - Remarks by Governor Gabriel Makhlouf at University of Galway

21 September 2023 Speech

Gabriel Makhlouf

Good morning. It is a pleasure to be here today to talk about the outlook for the labour market and inflation. My thanks to Professor Alan Ahearne for the invitation, and I look forward to the discussion afterwards and the audience Q&A. 

After reaching double digit figures late last year in the euro area – and almost double digits in Ireland – inflation has eased in recent months. 

The initial falls in 2023 were substantial, largely reflecting last year’s energy and food price shocks falling out of the baseline (Figure 1a).  

However, at 5.2 per cent in August in the euro area and 4.9 per cent in Ireland – more than double our 2 per cent euro-wide target – inflation remains too high.   

In recent months, disinflation has slowed and core inflation – that is, excluding food and energy prices – has fluctuated in a tight range around 5.5 per cent throughout 2023 (Figure 1b).  There is clearly more work to do in order to return inflation sustainably to our 2 per cent target, and in a timely manner.   

Figure 1a: Components of headline inflation (HICP Ireland)

Components of headline inflation (HICP Ireland)

Figure 1b: Headline and core inflation (Ireland)

Headline and core inflation (Ireland)

Source: Eurostat

The calibration of our monetary policy will be increasingly focused on domestic drivers of inflation. This is where the labour market, and wage developments in particular, play a significant role in our deliberations.

Today I will give an overview of recent labour market developments, and why these matter for wages and inflation, drawing on recent projections from the Central Bank of Ireland and the ECB.

If I was to sum up post-pandemic labour market dynamics in one word it would be resilient. Labour demand has proved resilient, with total employment showing little scarring from the pandemic. Labour supply has also proved resilient. Neither the euro area nor Ireland experienced the large fall in their labour force that we saw in the likes of the US and UK.  In fact, the size of the labour force in Ireland is far above pre-pandemic trends.

Yet, despite this strong supply response, many firms continue to report labour shortages.  And it is this third aspect of resilience that is the decisive one for the current monetary policy outlook, namely the current strong demand for workers, despite the growth slowdown in recent quarters and the sharp tightening of monetary policy over the last year.  This is contributing to historically tight labour markets, although we may have passed ‘peak tightness’, as seen through the recent decline in job openings in some countries, and weaker forward-looking employment indicators.    

In the first half of my speech, I will focus on the first two aspects of resilience: strong labour demand and supply.  This is important context for the remainder of my speech, where I focus on labour market tightness, wage dynamics and the implications for the inflation outlook.  I conclude with an overview of the economic outlook in the recent ECB projections and the Central Bank’s Quarterly Bulletin, published earlier this week.

The post-pandemic labour market: a tale of demand and supply

Employment in Ireland reached a new record of over 2.6 million in the second quarter of 2023, up by almost 12 per cent on 2019, and more than 5 per cent higher than pre-pandemic trend growth. In the euro area, employment stands at over 168.5 million persons, up 3 per cent on pre-pandemic levels and another record high. 

While 3 per cent euro area employment growth looks small compared to Ireland’s 12 per cent growth, it is important to place the figures in context.  Pre-pandemic trend employment growth was already stronger Ireland, for both demand and supply reasons.  Continental European countries face demographic headwinds due to falling birth-rates and ageing populations (Ireland is on a similar path, albeit some years behind).1For example, Italy’s working-age (15-64) population decreased by 3 per cent between 2020Q1 and 2023Q1, but employment increased marginally by 0.7 per cent, a 3.7 per cent swing.  The higher Italian employment rate – up from rising from 58.4 to 60.6 per cent – is due to a combination of lower unemployment (7.6 per cent in July 2023, down from 9.7 per cent in December 2019) and increased labour force participation (up from 65.6 to 66.2 per cent).

With the exception of euro area manufacturing, which has only recently returned to pre-pandemic levels, employment growth is spread across sectors (Figure 2a-2b).  Within services in Ireland, both business services and public services have had exceptionally strong employment growth in recent years.  

Developments in total hours worked have been weaker than employment (Figures 2c-2d), reflecting falling average hours worked.  In Ireland, compositional effects, such the increased labour force participation of younger groups and women over the age of 35, are one reason for the fall in average hours worked.2

Figure 2: employment and hours 2015-23

Figure 2a: Ireland (total employment)
Ireland (total employment)

Figure 2b: Euro area 19 (total employment)

Euro area 19 total employment

Figure 2c: Ireland (total hours)

Ireland (total hours)

Figure 2d: Euro area (total hours)

Euro area (total hours)

Last observation is Q2 2023
Source: Eurostat.

Along with the expansion of employment, unemployment has fallen. In the euro area, unemployment reached a new low of 6.4 per cent in June 2023.  For Ireland, the unemployment rate has hovered between 4.1 and 4.2 per cent throughout 2023.  This is one of the lowest unemployment rates among the 20 euro area countries, with only Germany, the Netherlands, Malta and Slovenia having lower rates.  

As noted earlier, a large share of employment growth has come from outside the labour force, especially in Ireland (Figure 3) where the labour force has grown at rates far above pre-pandemic trends.3 Irish and euro area labour force developments contrast sharply with those in the UK and US, as the charts show.

Figure 3: Labour Force 2014-23

Figure 3a: Ireland & Euro area - Labour Force

Ireland Europe – Labour Force

Figure 3b: US & UK - Labour Force

US/UK – Labour Force

Last observation is August 2023
Source: Eurostat, UK ONS and US BLS.

In Ireland, labour force growth has been exceptionally strong across several different groups (Figure 4), including those with third level education, younger age groups, females and non-nationals.   The role of inward migration in Irish and euro area labour supply is an important one, also for wage dynamics.  Migration helps to fill labour demand across all sectors, but proportionally it plays a very significant role in construction and consumer-facing sectors in Ireland (Figure 5).

Figure 4: Composition of labour force growth

Composition of labour force growth 2019Q4-2923Q1 (relative to trend)

Source: Eurostat, Labour Force Survey, seasonally adjusted data.
*Growth is relative to the pre-pandemic trend from 2015 Q1 to 2019Q4.

Figure 5: Net employment gain by nationality (Ireland, Q4 2019 – Q4 2022)

Net employment gain by nationality (Ireland, Q4 2019 – Q4 2022)

Source: Labour Force Survey and Quarterly Bulletin 3 2023

Wages and inflation

Labour costs account for a significant share of firms’ overall costs, especially in more labour intensive sectors. For example, in accommodation and food services firms in Ireland, the labour share in 2021 was 86 per cent; in the ‘other services’ category, which also includes many consumer-facing services, it is 90 per cent.4

To understand the potential for cost-push inflation from wages, we need to know the pass-through from wages to prices.  For Ireland, estimates range from around 60 per cent in construction to over 80 per cent in firms in the services sector, with similar figures for other euro area countries.5  Pass-through can also be higher when inflation is higher. This can happen for different reasons such as shifting inflation expectations or because of strong demand, which allows firms to more easily pass through higher input costs with lower risk of significant negative demand impacts at the firm-level.

All of this means that central banks need to closely monitor wage developments as a potential source of future inflation.  Given what I am seeing in the data, three questions come to mind:

  • What are we seeing in current labour market tightness measures, and what are the implications for wage growth?
  • Over what sort of time period do real wages adjust to an unexpected inflation surge like we have seen in the last two years?
  • How is our monetary policy transmitting to labour demand?

In the final section, where I summarise recent decisions and projections, I address the final two questions, but first: how tight is the labour market?

How tight is the labour market?

Recognising that labour supply often comes from new workers that our outside the labour force, Central Bank research released earlier this week uses a wider measure of labour market ‘slack’ which, in addition to unemployed persons, includes persons who are partially attached to the labour force (or ‘PALF’) and who had previous work experience (Figure 6).6  The motivation for including the PALF group is that they tend to have very similar transition rates into employment as ILO unemployed individuals, of between 13 and 16 per cent per quarter in the historic data.

The research finds that this wider unemployment measure can help to explain past wage dynamics in a Phillips curve, using data from 2000-2019.  Past inflation also puts significant upward pressure on nominal wages.  The key message from the analysis that even after including other variables such as inward migration, exchange rates and productivity, the model over predicts recent wage growth.  In other words, based on historical patterns in the data, we would have expected higher wage growth in recent quarters, given observed labour market tightness and past inflation.

The gap is around +1.5 percentage points, and inflation developments explain the vast majority of it.  The key issue here is there is nothing like the 2022-23 inflation surge in the data used to estimate this model (2000-19).7 One reading of this is that the high inflation in 2022 was largely unexpected by wage earners, and it may take longer for the pass through of higher consumer prices to earnings growth than had higher inflation been expected, leading to a delayed adjustment of real wages over time.  Of course, the speed and extent of this real wage catch-up also depends on the evolving economic backdrop.  

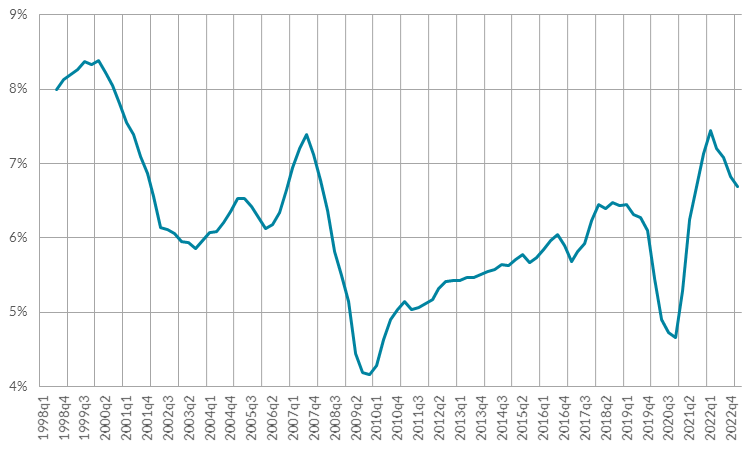
Figure 6: Labour market slack: Unemployed+PALF*

Labour market slack: Unemployed+PALF*

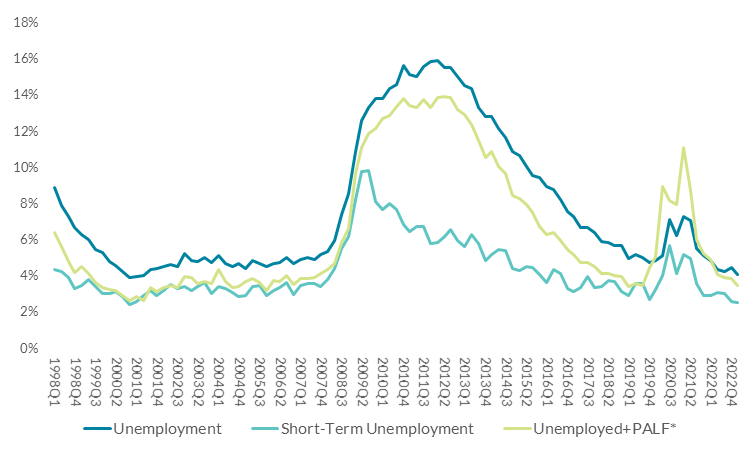
Source: QB article, based on CSO data.

The unemployment plus PALF tightness metric in this Philips curve estimation is largely from the supply side.  However, as tightness is also about the balance of supply and demand, we need to consider labour demand. 

The job vacancy rate, which increased sharply around post-pandemic re-opening (Figure 7), is one measure of labour demand.  In recent months, job vacancies have fallen slightly from post-pandemic highs, which suggests an easing of labour demand.  However, the job vacancy rate and the number of job openings remain above pre-pandemic levels.

Figure 7: Job vacancy rate

Job vacancy rate

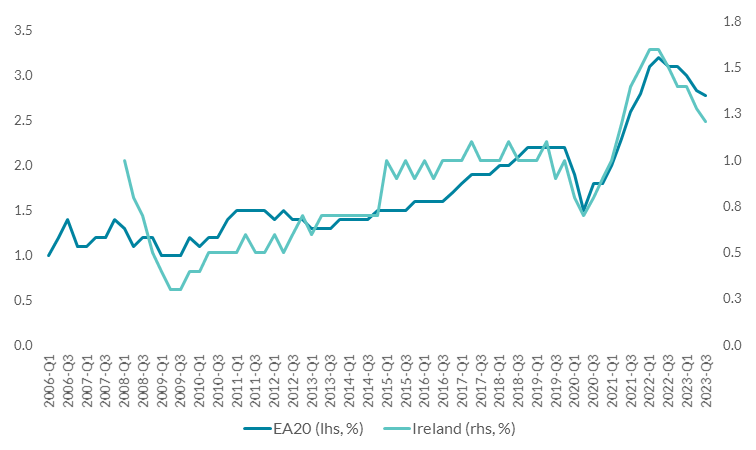
Source: Eurostat to 2023 Q1. Indeed for Q2 and Q3 2023.  Seasonally adjusted.

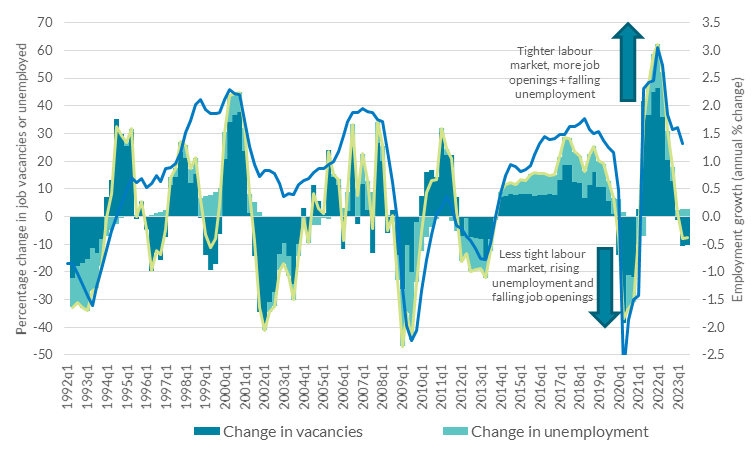
Job vacancies and unemployment tend to have an inverse relationship, as plotted in the Beveridge curve.  Cyclical economic variation is marked by movements along the curve, whereas structural changes – such as a change in job matching efficiency – shift the position of the curve.  The growth in vacancies that we have observed, alongside falling unemployment during 2022/23, point to cyclically strong labour demand as the main driver of labour market tightness.  

Figure 8: Beveridge Curve

Figure 8a: Ireland

Beveridge Curve - Ireland

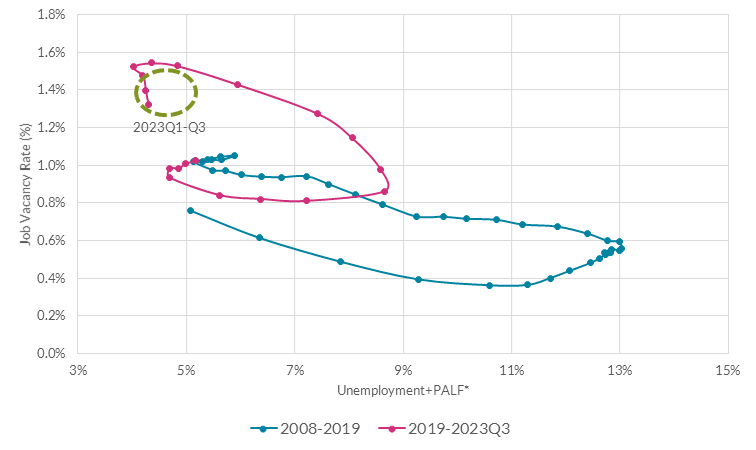
Figure 8b: Euro area

Beveridge Curve - Euro Area

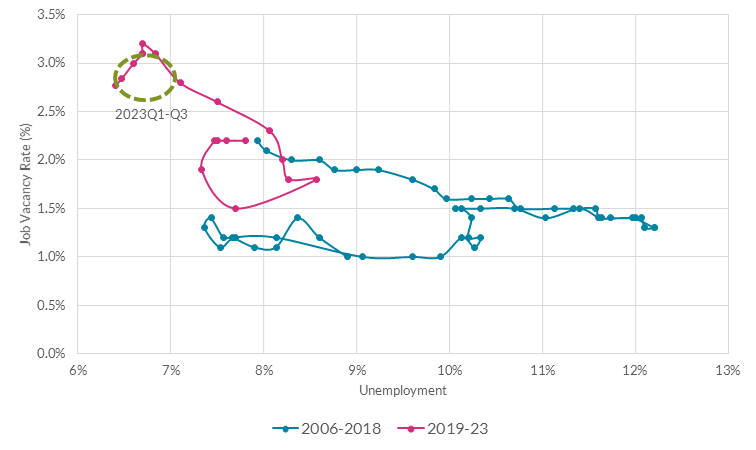
Source: QB article and Eurostat. Indeed data on job openings for Q2 and Q3 2023.

The recent fall-off in job vacancies – albeit from a very high level – suggests that tighter monetary policy is beginning to slow demand.  However, it will take time for the full impact to become clear and monetary policy will need to remain restrictive for some time before we can be confident we are on the right path. 

Before moving on to our latest monetary policy decision, I want to touch on the issue of trade-offs in the context of disinflation and labour market dynamics. 

Historically, the slope of the Phillips curve described the trade-off between unemployment (or slack) and inflation.  However, recent work that includes the vacancy to unemployment ratio (‘VU-ratio’) in the Phillips curve raises the important question of whether an easing in labour demand occurs mostly at the hiring margin – in other words, fewer job openings – or whether unemployment also rises.8

In the US, which started its hiking cycle earlier than the euro area, the adjustment so far has been mainly through a reduction in job openings.  At the same time, job switching, an important driver of wage growth dynamics there, have fallen back to pre-pandemic levels.9 Wage growth has also slowed markedly in recent months.

For Ireland, we only have a short time-series of job vacancy data, so it is difficult to compare changes in the VU-ratio over previous cycles.  However, recent job hiring statistics show that the post-pandemic surge peaked in the first half of 2022, and has since fallen back (Figure 9).  Along with the decline in job openings, this is further evidence of some weakening of the demand momentum that built up after re-opening.  However, at 6.7 per cent (of total employment) in Q1 2023, the new hiring rate remains above its long-run average of around 6 per cent. 

Figure 9: New hires (Ireland, as  per cent of employment)

New hires (Ireland, as per cent of employment)

Source: Labour Force Survey (CSO).  New hires are defined as workers with job tenure of three months or less in a given quarter.

For the euro area as a whole, we can construct a longer VU-ratio time series back to the early-1990s.  Decomposing changes in the VU-ratio, a number of stylised facts emerge (Figure 10).  First, cyclical variation in the employment rate are typically accompanied by changes in both job vacancies and unemployment (moving in opposite directions).  That said, there are some cyclical slowdowns where job vacancies declined but unemployment did not rise, for example in the mid- and late-1990s.  The dot-com bust, which shows up as below-trend employment growth during 2002-03 is another episode where job vacancies accounted for the bulk of the change in the VU-ratio, although unemployment also rose slightly during this period.  The main lessons I draw from the data is that cyclical slow-downs in employment growth are often accompanied by fewer job openings and higher unemployment. Having said that, ‘soft-landings’ – that is where unemployment does not materially rise – are possible, especially in shallower and shorter slowdowns.   

Figure 10: Ratio of vacancies to unemployed persons (euro area)

Ratio of vacancies to unemployed persons (euro area)

Source: Eurostat from 2006 onwards.  Prior to 2006, the VU-ratio is imputed from data on labour shortages collected by the European Commission.

Recent monetary policy decision and the outlook

While we quickly saw the impact of our monetary policy tightening in financial markets and bank interest rates even before policy started to rise last year, the effects on economic activity have become more apparent in recent months.  People and businesses are taking out fewer loans, which will impact consumption and business investment, dampening aggregate demand. 

However, despite recent falls, inflation remains too high. Therefore, in order to reach our 2 per cent target in a timely manner, and reinforce the progress we have made towards achieving this target, the Governing Council last week raised its key interest rates by a quarter of a percentage point.

The deposit facility rate now stands at 4 per cent, up from minus 0.5 per cent in July 2022.

The ECB staff macroeconomic projections see average inflation at 5.6 per cent in 2023, 3.2 per cent in 2024 and 2.1 per cent in 2025.  Underlying, or core inflation is expected to average 5.1 per cent in 2023, 2.9 per cent in 2024 and 2.2 per cent in 2025.  For Ireland, our own Quarterly Bulletin projections, released earlier this week, show a similar disinflation path (Figure 11).  In both cases, the core inflation projection is under-pinned by historically strong wage growth.

Figure 11: Inflation projections to 2025

Figure 11a: Headline inflation (HICP)

Headline inflation (HICP)

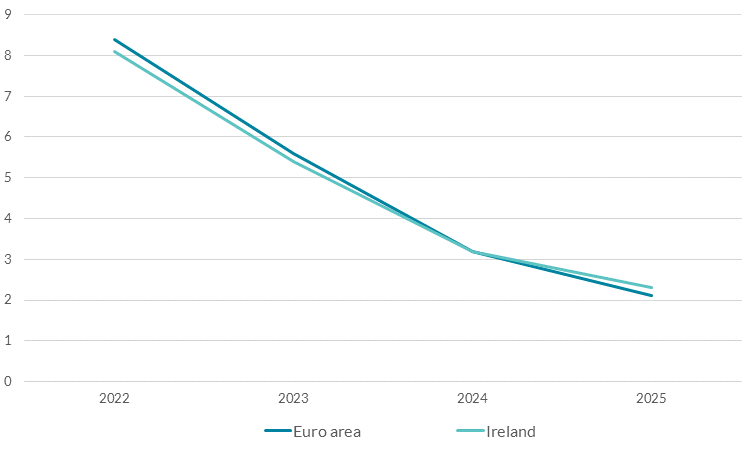
Figure 11b: Core (excl. food and energy)

Core (excl. food and energy)

Source: ECB and Central Bank of Ireland.

Relative to the June projections, the main change in the ECB staff projections was the downward revision to euro area growth.  Growth in 2023 is now expected to be 0.7 per cent (down from 0.9 per cent) in June.  But the major revisions were for 2024 – 0.5 per cent down from 1.5 per cent – and (less so) 2025 – 1.5 per cent, down from 1.6 per cent.

The downgrade of the short-term euro area outlook reflects weaker survey indicators, such as indicators of future orders and employment growth, tighter financing conditions and the stronger euro exchange rate since June.  Although there has been some reversal of the latter since the decision last week.

For Ireland, our projections for growth in modified domestic demand in 2023 have been also revised down, from 3.7 per cent to 2.9 per cent, while the 2024 (2.6 per cent) and 2025 (2.3 per cent) profile is broadly similar to our June projections.

Reflecting the growth slowdown, employment growth for the euro area has also been revised down.  It is expected to be roughly flat in the second half of 2023, and to average just 0.2 per cent in 2024 and 2025.  This is a significant downgrade from the June projections of 0.5 per cent (2024) and 0.4 per cent (2025).  It also represents an extended period of below trend employment growth for the euro area (trend growth in employment for 2014-19 was 1.4 per cent), and is consistent with the monetary policy stance remaining tight throughout.

For Ireland, employment growth in 2023 has been upgraded from 2.5 per cent in our June Quarterly Bulletin to 3.7 per cent in September numbers. This change reflects strong Labour Force Survey figures for Q2 2023. Employment growth of 1.7 per cent and 1.5 per cent in each of 2024 and 2025 is broadly similar to the June projections.  The lower growth rate in 2024 reflects both supply and demand factors (including tighter monetary policy). On the supply side, we anticipate constraints beginning to bite as our measure of slack (unemployment+PALF) remains historically low, as well as lower migration due to ongoing housing supply issues.

The projections include a small uptick in the unemployment rate in the euro area, rising from its current historical low of 6.4 per cent to 6.7 per cent in 2025. For Ireland, we expect it to remain low throughout the projection horizon, at around 4.3 per cent.  Given the expected slowdown in employment growth, this means a likely further decline in job vacancies in the coming months.  Despite this, the combined effects of low unemployment and real wage catch-up will contribute to strong wage growth significantly above historical levels, especially for the euro area (Figure 12).   

Figure 12: Nominal wage growth

Figure 12a: Euro area

Nominal wage growth (Ireland)

Figure 12b: Ireland

Nominal wage growth (Ireland)

Source: ECB and Central Bank of Ireland. CPE is growth in compensation per employee (CSO); Negotiated wages is from the ECB-SDW; EHECs wage growth is from the CSO; and IWGT refers to the ‘Indeed Wage Growth Tracker’ (see Adrjan & Lydon, 2022).

These wage growth forecasts underpin the underlying (core) inflation projections, for both Ireland and the euro area.  If wage growth turns out to be weaker, then we may see a faster decline in core inflation than currently envisaged. If it turns out to be stronger, then the core inflation will prove stickier.

How is it that core inflation is projected to decline, even in the face of historically high wage growth? The answer is that other factors are expected to exert downward pressure on core inflation over the projection horizon, falling input costs from non-labour factors as supply chains normalise, lower profit margins and rising labour productivity. 

To conclude, I want to outline what I see as the key risk factors around these wage projections. 

On the upside, I see two potential upside risks. One is a more resilient labour demand.  And to monitor this I will be closely following both employment growth and job vacancy statistics.

The second is inflation expectations – not something I have paid attention to in my speech today, but nonetheless important.  The experience of the 1970s taught us the importance of inflation expectations for wage and price dynamics.  In the euro area, expectations increased with the recent surge in inflation, although recent data points to a gradual return to our 2 per cent target for short-term consumer inflation expectations, and medium-term expectations remaining anchored around our 2 per cent target.  The anchoring of medium-term expectations plays an important role in our projected disinflation path.

On the downside risks to wage growth, I primarily see one: downside risks to economic growth itself. As we saw in the historical analysis of vacancy-unemployment dynamics, a longer and deeper slowdown could lead to a bigger increase in the unemployment rate, which will put downward pressure on wages.  To monitor this, I will be paying close attention to monthly unemployment dynamics, softer indicators such as PMI employment expectations, and wage trackers, such as that developed at the Central Bank of Ireland in collaboration with Indeed.  I will also be listening closely to what companies in Ireland and the euro are tell us as part of our regular market intelligence gathering exercises. 

As you can see, there are many factors that go into our monetary policy decisions. At each of our six-weekly meetings, the Governing Council assesses what the available evidence tells us about the path for underlying inflation and the transmission of our monetary policy to-date. This is the essence of what ‘data dependent’ means, and it brings me to my final point. 

One aspect of our recent decision that has received some attention was the statement that “key ECB interest rates have reached levels that, maintained for a sufficiently long duration, will make a substantial contribution to the timely return of inflation to the target”.  Substantial does not mean complete and this should not be interpreted as an unconditional commitment that we have reached the so-called ‘peak rate’ in this hiking cycle.  It is the Governing Council’s current view of the monetary policy path based on what we are seeing in the data right now, and our recent projections, a view that could change if some of the risk factors that I have highlighted materialise.

 This is the essence of our “data-dependent approach to determining the appropriate level and duration of restriction”.  As our statements have made clear for some time: “interest rate decisions will be based on [the Governing Council’s] assessment of the inflation outlook in light of the incoming economic and financial data, the dynamics of underlying inflation, and the strength of monetary policy transmission.”

Thank you.10

--

1 In my previous speeches and blogs, I have highlighted demographic issues, and specifically ageing populations as one of the key long-term challenges that lie ahead for both Ireland and the euro area.  See, for example, my 2019 speech on “Resilience through transitions: facing the tumult”. 

2 See Quarterly Bulletin 3, 2022 for analysis of labour supply dynamics in recent years.

3 See the Central Bank Ireland Quarterly Bulletin Article on “Labour Market Recovery After a Pandemic” (QB 3, 2022) for a detailed overview of these developments.  The recent Quarterly Bulletin article on “Earnings growth under high inflation” also highlights the important of labour supply-demand balance for wage dynamics, including the significant role playing by net inward migration. 

4 See CSO Table PIA 15. The share is slightly lower in the likes of transport (74%) and construction (66%), but rarely is it lower than the overall average of around 50%. The two major exceptions are manufacturing sectors dominated by foreign-owned multinationals (6%) and ICT (15%), both major exporters.

Based on a forthcoming Central Bank of Ireland Economic Letter “How much do changes in labour costs matter for Irish inflation?” (Liss, Keenan & Lydon).  Irish estimates are similar to other euro area countries, e.g. Bobeica et al. (2019).

PALF is designed to capture persons who are not part of the traditional labour force definition, but who may nonetheless have a strong attachment to it. Formally, it includes persons who are ‘Seeking work but not immediately available’ and ‘Available for work but not seeking work’. See the CSO website for details.

Looking further back, the energy price shocks of the 1970’s a potentially relevant episode for comparison.  However, in this case, I believe the past really is a different country.  Both levers of macroeconomic policy – monetary and fiscal – worked very differently at the time. For example, one major difference in current monetary policy frameworks is the appreciation of the importance of inflation expectations, a lesson only learned as a result of the policy mistakes of the 1970s. Further, wage setting in the 1970s was more decentralised and tended to have more formulaic cost of living adjustments, just one example of the ways in which the industrial relations infrastructure differs from that of today. 

8 The idea that labour market tightness impacts wage growth goes right back to the original Phillips Curve in the late 1950s.  Despite many iterations over the decades, depending on shocks hitting the economy, and our understanding of labour market and inflation dynamics, the Phillips curve remains a commonly-used framework for policy makers.  For an overview of current academic and policy debates on the Phillips curve, see the ‘Phillips Curve” session at the recent ECB-Cleveland Fed “Inflation: Drivers and Dynamics Conference 2023”.  For recent policy applications that include the VU-ratio in the Phillips curve, see Bernanke and Blanchard (2023) and Benigno and Eggertson (2023).

9 See Staunton and Lydon (2018) “Does increased job switching signal higher wage growth?” for analysis of the relationship between job switching and wage growth in Ireland.

10 With thanks to Rea Lydon for his assistance in preparing these remarks.